Distribusi Normal • Part 11: Contoh Soal Menentukan Nilai Z dari Peluang / Luas Daerahnya (1)
Summary
TLDRThis video explains how to determine Z-scores in normal distribution problems, particularly when the area under the curve is known. The presenter walks through multiple examples, demonstrating how to use Z-tables to find corresponding Z-values based on given probabilities. The focus is on both positive and negative Z-scores, offering a detailed, step-by-step guide on how to reverse-engineer the calculation of Z-values from the area under the normal curve. The tutorial covers a variety of scenarios, making complex concepts easy to understand for viewers seeking to master normal distribution.
Takeaways
- 😀 The video covers how to determine the value of a standard normal variable (Z) given the probability or the area under the curve.
- 😀 The first example explains how to find the Z value corresponding to a probability of 0.3907 using a Z-table.
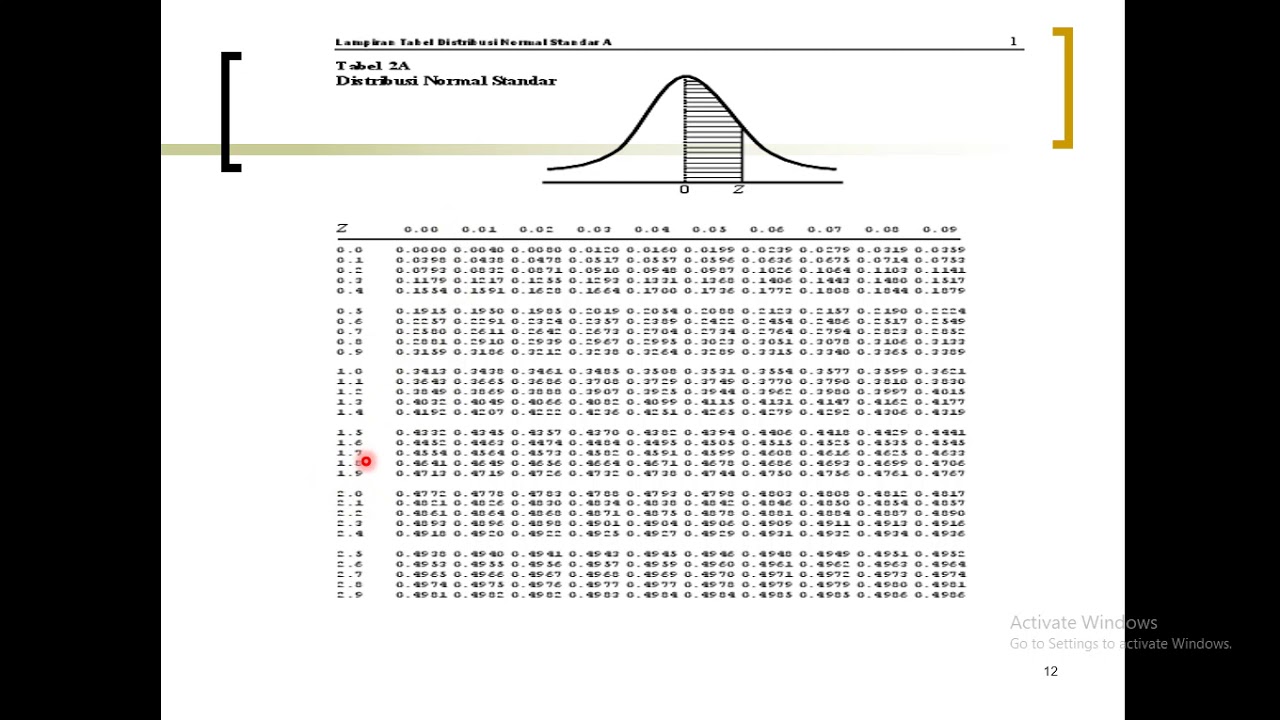
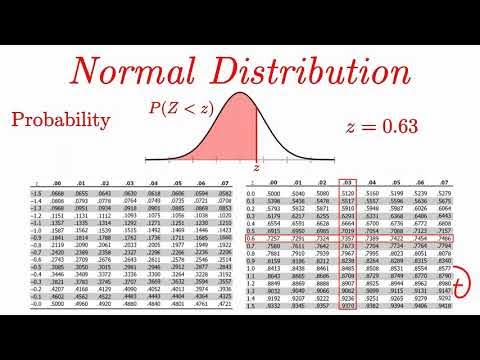
- 😀 The Z-table used shows the probability for the area under the standard normal curve from 0 to Z, and helps determine the Z value for a given probability.
- 😀 In the first example, after finding the closest probability value in the table (0.3907), the Z value is found to be 1.23.
- 😀 The second example discusses how to determine the Z value for a probability of 0.9406, where the total probability is between negative infinity and Z.
- 😀 For the second example, the curve is drawn to visually represent the probability, and the area is split into two parts to aid in calculation.
- 😀 Using the Z-table, the probability of 0.4406 is found, which corresponds to a Z value of 1.56 in the table.
- 😀 The third example introduces a probability of 0.6406, with a focus on negative Z values and their relationship to the probability.
- 😀 The symmetry of the normal distribution is used in the third example to transform a probability into a positive Z value, giving a final answer of -0.36 for Z.
- 😀 The examples demonstrate how to manipulate the area and probability relationships under the normal curve to find Z values, including handling negative values and using symmetry.
- 😀 The video ends with a reminder for viewers to check the complete playlist for more related lessons and encourages them to leave questions or comments.
Q & A
What is the main topic of this video?
-The main topic of the video is about understanding and solving normal distribution problems, particularly how to find the Z-score when the probability or area under the normal curve is given.
What is the significance of Z-scores in normal distribution?
-Z-scores are used to determine how many standard deviations a data point is from the mean in a normal distribution. They are essential for calculating probabilities and understanding the distribution of data.
How do you find the Z-score when the probability (or area under the curve) is given?
-To find the Z-score, you refer to the standard normal distribution table. You locate the probability (or area) under the curve and use the table to find the corresponding Z-score.
In the first example, what is the Z-score corresponding to a probability of 0.3907?
-The Z-score corresponding to a probability of 0.3907 is 1.23, found by referring to the standard normal distribution table.
What is the difference between using a standard normal distribution table for left and right tail probabilities?
-For left-tail probabilities, the area starts from 0 and goes to the Z-score. For right-tail probabilities, the area starts from negative infinity and goes to the Z-score. You may need to adjust your approach based on which tail of the curve the probability refers to.
How do you approach finding a Z-score when the probability is given for a right-tail (i.e., starting from negative infinity)?
-In this case, you draw the curve and recognize that the probability refers to the area from negative infinity to the Z-score. You then split the probability into two parts and use the normal distribution table to solve for the Z-score.
What is the Z-score corresponding to a probability of 0.9406 for a right-tail probability?
-The Z-score corresponding to a probability of 0.9406 is 1.56, found by splitting the probability and using the standard normal distribution table.
How do you handle negative Z-scores in normal distribution problems?
-When encountering negative Z-scores, you reflect the values to positive Z-scores using the symmetry of the normal distribution. This means that a negative Z-score corresponds to a positive value in the standard normal distribution table.
In the third example, how do you handle a probability of 0.6406?
-For a probability of 0.6406, the Z-score is negative because the area lies on the left side of the mean. You split the probability into two parts, calculate the corresponding Z-scores using the table, and then adjust for the negative Z-score.
Why is the standard normal distribution table important for solving these problems?
-The standard normal distribution table is crucial because it provides the cumulative probabilities (or areas under the curve) for various Z-scores. This allows us to find the Z-score corresponding to a given probability or vice versa.
Outlines

Cette section est réservée aux utilisateurs payants. Améliorez votre compte pour accéder à cette section.
Améliorer maintenantMindmap

Cette section est réservée aux utilisateurs payants. Améliorez votre compte pour accéder à cette section.
Améliorer maintenantKeywords

Cette section est réservée aux utilisateurs payants. Améliorez votre compte pour accéder à cette section.
Améliorer maintenantHighlights

Cette section est réservée aux utilisateurs payants. Améliorez votre compte pour accéder à cette section.
Améliorer maintenantTranscripts

Cette section est réservée aux utilisateurs payants. Améliorez votre compte pour accéder à cette section.
Améliorer maintenantVoir Plus de Vidéos Connexes
CONVERTING A NORMAL RANDOM VARIABLE TO A STANDARD NORMAL VARIABLE AND VICE VERSA
Distribusi Normal | Konsep Dasar dan Sifat Kurva Normal | Matematika Peminatan Kelas 12

Distribusi Normal Bagian 1 Matematika Minat Kelas XII Semester 2

Z-Scores, Standardization, and the Standard Normal Distribution (5.3)
Distribusi Probabilitas Normal
Normal Distribution EXPLAINED with Examples
5.0 / 5 (0 votes)
