Regresi Linear Sederhana dengan Ordinary Least Square
Summary
TLDRThis video explains the basics of linear regression analysis, focusing on Ordinary Least Squares (OLS) method. It covers how to model data relationships, determine regression coefficients, and evaluate model fit. The script introduces concepts like dependent and independent variables, regression assumptions, and residuals. Key methods for calculating regression coefficients and minimizing error through OLS are discussed, along with how to assess the model's quality using the R-squared value. The video encourages viewers to understand and apply these techniques for data prediction and analysis in statistical studies.
Takeaways
- 😀 Linear regression is a widely used statistical method to model and analyze the relationship between dependent and independent variables.
- 😀 In regression analysis, the dependent variable (Z) is the outcome, while the independent variable (X) is used to predict or explain the outcome.
- 😀 The first step in regression analysis is estimating the relationship between variables, followed by interpreting results, conducting hypothesis testing, and making predictions.
- 😀 The Ordinary Least Squares (OLS) method is commonly used to estimate the coefficients of a simple linear regression model by minimizing the sum of squared errors.
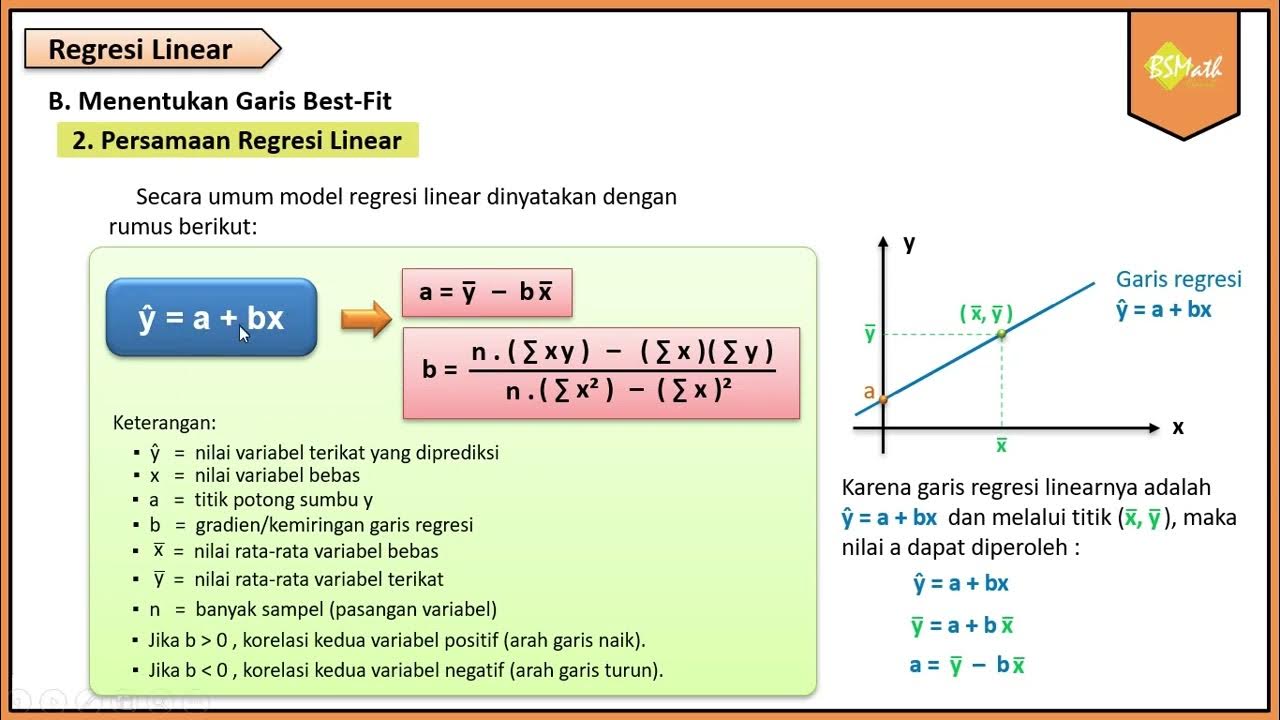
- 😀 In the linear regression model, the equation is written as Y = β1 + β2X + ε, where Y is the dependent variable, X is the independent variable, β1 and β2 are the regression coefficients, and ε represents the error term.
- 😀 Regression and correlation are related but differ in that regression assumes a cause-and-effect relationship, while correlation treats both variables symmetrically.
- 😀 OLS minimizes the vertical distance (residuals) between the actual data points and the predicted values on the regression line.
- 😀 The process of determining regression coefficients involves differentiating the sum of squared errors with respect to the coefficients and solving the resulting equations.
- 😀 The coefficient of determination (R²) is used to measure the goodness of fit of the regression model, representing the proportion of variance in the dependent variable explained by the model.
- 😀 It’s important not to rely solely on R² to assess the quality of a regression model; other diagnostic measures should also be considered to evaluate the overall fit.
- 😀 Linear regression can be used for making predictions about the dependent variable based on new values of the independent variable, and it's a key tool for data analysis and forecasting.
Q & A
What is simple linear regression and how is it used?
-Simple linear regression is a statistical method used to model the relationship between a dependent variable (Y) and an independent variable (X). It is primarily used to predict the value of the dependent variable based on the value of the independent variable.
What is the purpose of Ordinary Least Squares (OLS) in regression analysis?
-Ordinary Least Squares (OLS) is a method used to estimate the coefficients of a linear regression model. It minimizes the sum of the squared differences between the actual data points and the predicted values (residuals) to find the best-fitting line.
What are the key steps involved in performing regression analysis?
-The key steps in regression analysis include estimating the relationship between variables, interpreting the results, performing model goodness-of-fit tests, conducting hypothesis tests, and using the model for forecasting or prediction.
What are the common terms used to describe the variables in a regression model?
-In a regression model, the dependent variable is often referred to as the 'response variable,' 'regression explained,' or 'endogenous.' The independent variable is referred to as the 'predictor,' 'regressor,' 'explanatory variable,' or 'exogenous.'
How do residuals play a role in regression analysis?
-Residuals represent the difference between the observed values and the predicted values of the dependent variable. They are used to assess the fit of the regression model and to check for any patterns that may indicate issues with the model.
What is the significance of the coefficients in a simple linear regression model?
-The coefficients in a simple linear regression model (denoted as beta1 for the intercept and beta2 for the slope) represent the relationship between the independent variable and the dependent variable. Beta1 is the predicted value of Y when X is 0, and beta2 indicates how much Y changes for a one-unit change in X.
How is the coefficient of determination (R-squared) used in regression analysis?
-The coefficient of determination (R-squared) measures how well the regression model explains the variance in the dependent variable. It is calculated as the proportion of the total variance in Y that is explained by the regression model, with values ranging from 0 to 1.
Why is R-squared not the sole indicator of model quality?
-R-squared provides useful information about how well the model fits the data, but it should not be the only criterion for model quality. Other factors, such as residual analysis and hypothesis testing, must be considered to assess the validity of the model.
What is the formula for calculating R-squared in regression analysis?
-R-squared is calculated as 1 minus the ratio of the residual sum of squares (RSS) to the total sum of squares (TSS). The formula is R-squared = 1 - (RSS / TSS), where RSS is the sum of squared residuals and TSS is the total variation in the dependent variable.
How do you estimate the parameters of a regression model using OLS?
-To estimate the parameters of a regression model using OLS, you minimize the sum of squared residuals by taking partial derivatives of the error function with respect to the parameters (beta1 and beta2). This leads to a system of equations that, when solved, provide the estimates of the coefficients.
Outlines

Cette section est réservée aux utilisateurs payants. Améliorez votre compte pour accéder à cette section.
Améliorer maintenantMindmap

Cette section est réservée aux utilisateurs payants. Améliorez votre compte pour accéder à cette section.
Améliorer maintenantKeywords

Cette section est réservée aux utilisateurs payants. Améliorez votre compte pour accéder à cette section.
Améliorer maintenantHighlights

Cette section est réservée aux utilisateurs payants. Améliorez votre compte pour accéder à cette section.
Améliorer maintenantTranscripts

Cette section est réservée aux utilisateurs payants. Améliorez votre compte pour accéder à cette section.
Améliorer maintenantVoir Plus de Vidéos Connexes

6.1 Effects of Data Scaling on OLS statistics (changing units of measurement)

Memahami Perbedaan Uji Multikolinieritas, Heteroskedastisitas, Autokorelasi, dan Normalitas

Regresion Lineal

Metode Kuadrat Terkecil Hal 97-101 Bab 3 STATISTIK Kelas 11 SMA Kurikulum Merdeka

Modul 12 (StatSos2) - Konsep Dasar Regresi Linear Sederhana

Persamaan Regresi Linear - Matematika Wajib SMA Kelas XI Kurikulum Merdeka
5.0 / 5 (0 votes)
