Metode Kuadrat Terkecil Hal 97-101 Bab 3 STATISTIK Kelas 11 SMA Kurikulum Merdeka
Summary
TLDRThis educational video tutorial explains the concept of linear regression using the least squares method. It focuses on how to plot data points on a scatter diagram, draw the regression line, and calculate the residuals. The video guides viewers through the steps of finding the best-fit line by minimizing the sum of squared residuals, using both manual calculations and Excel. It also covers the historical background of the least squares method and encourages students to compare their results with peers. Overall, the tutorial is a comprehensive introduction to linear regression for high school students.
Takeaways
- 😀 The lesson focuses on teaching linear regression using the least squares method.
- 😀 The content is based on the curriculum from the Merdeka curriculum package for grade 11 students in SMA/SMK.
- 😀 A school implemented a saving program for students, and data was collected showing the relationship between pocket money and savings.
- 😀 To create a scatter plot, students can use Microsoft Excel to plot the x-values (pocket money) and y-values (savings).
- 😀 The scatter plot can be created by selecting the data and using Excel's 'Insert' function to generate a chart.
- 😀 The linear regression line (best fit line) can be drawn manually by connecting two points from the data, such as (10,000, 2,000) and (5,000, 10,000).
- 😀 The rationale behind drawing the best fit line is to minimize the distance between the points above and below the line (using the least squares method).
- 😀 The least squares method, invented by Carl Friedrich Gauss and Adrien-Marie Legendre, minimizes the sum of squared residuals (the difference between observed and predicted values).
- 😀 The formula for calculating residuals is ε = y - ŷ, where y is the observed value and ŷ is the predicted value from the regression line.
- 😀 Students are encouraged to use a calculator or Excel to calculate the slope (m) and intercept (c) of the regression line using the formula ŷ = mx + c.
Q & A
What is the main focus of this lesson?
-The main focus of this lesson is on linear regression using the least squares method, specifically as taught in Chapter 3 of the 'Paket' textbook for the Merdeka curriculum, covering pages 97 to 101 for class 11 SMA SMK students.
What is the purpose of the scatter plot in this lesson?
-The purpose of the scatter plot is to visually represent the relationship between two variables: pocket money and savings, as part of an exercise to apply linear regression.
How can we create a scatter plot in Microsoft Excel?
-To create a scatter plot in Excel, you need to enter the x and y values in the spreadsheet, select them, and then insert a chart. You can choose the scatter chart option to generate the plot.
What is the 'best-fit line' in the context of this exercise?
-The 'best-fit line' is a line that best represents the relationship between the two variables on the scatter plot, drawn manually by connecting two points, such as (10,000; 2,000) and (5,000; 10,000).
What does the term 'residual' refer to in regression analysis?
-A residual refers to the difference between an observed data point and the predicted value from the regression line. In other words, it is the vertical distance from a point on the scatter plot to the regression line.
What is the least squares method used for in linear regression?
-The least squares method is used to minimize the sum of the squared residuals, which provides the most accurate 'best-fit' line. It helps find the line that best predicts the dependent variable.
How do you calculate the equation of the regression line?
-To calculate the regression line's equation, first find the gradient (m) and the y-intercept (c) by using known points on the line. The general equation for the line is ŷ = mx + c, where m is the gradient and c is the y-intercept.
What is the formula for calculating the residual?
-The formula for calculating the residual is ε = y - ŷ, where y is the observed value and ŷ is the predicted value from the regression line.
How is the sum of squared residuals calculated?
-The sum of squared residuals is calculated by squaring each residual (ε²) and then summing them up. This helps measure how well the regression line fits the data.
How does using Excel simplify the regression analysis process?
-Excel simplifies the regression analysis process by automating calculations for the regression line, residuals, and sum of squared residuals, making it easier to analyze and visualize the data without manual computation.
Outlines

This section is available to paid users only. Please upgrade to access this part.
Upgrade NowMindmap

This section is available to paid users only. Please upgrade to access this part.
Upgrade NowKeywords

This section is available to paid users only. Please upgrade to access this part.
Upgrade NowHighlights

This section is available to paid users only. Please upgrade to access this part.
Upgrade NowTranscripts

This section is available to paid users only. Please upgrade to access this part.
Upgrade NowBrowse More Related Video
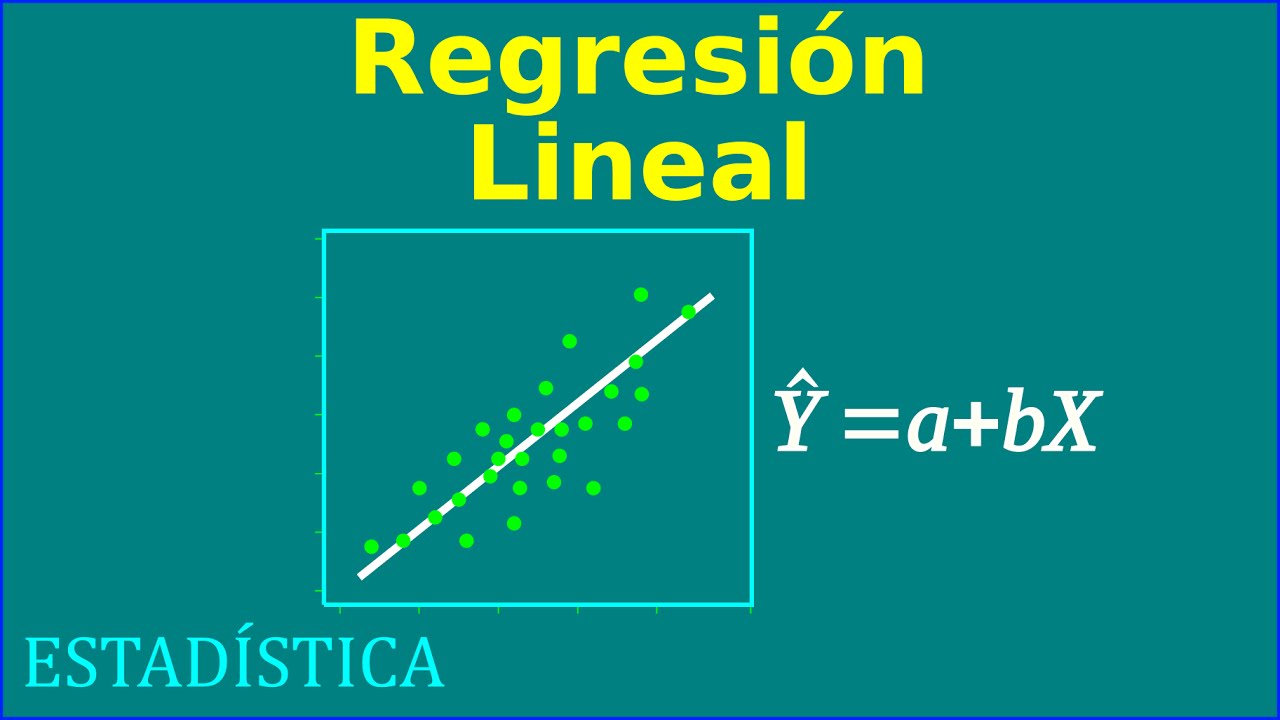
Regresion Lineal
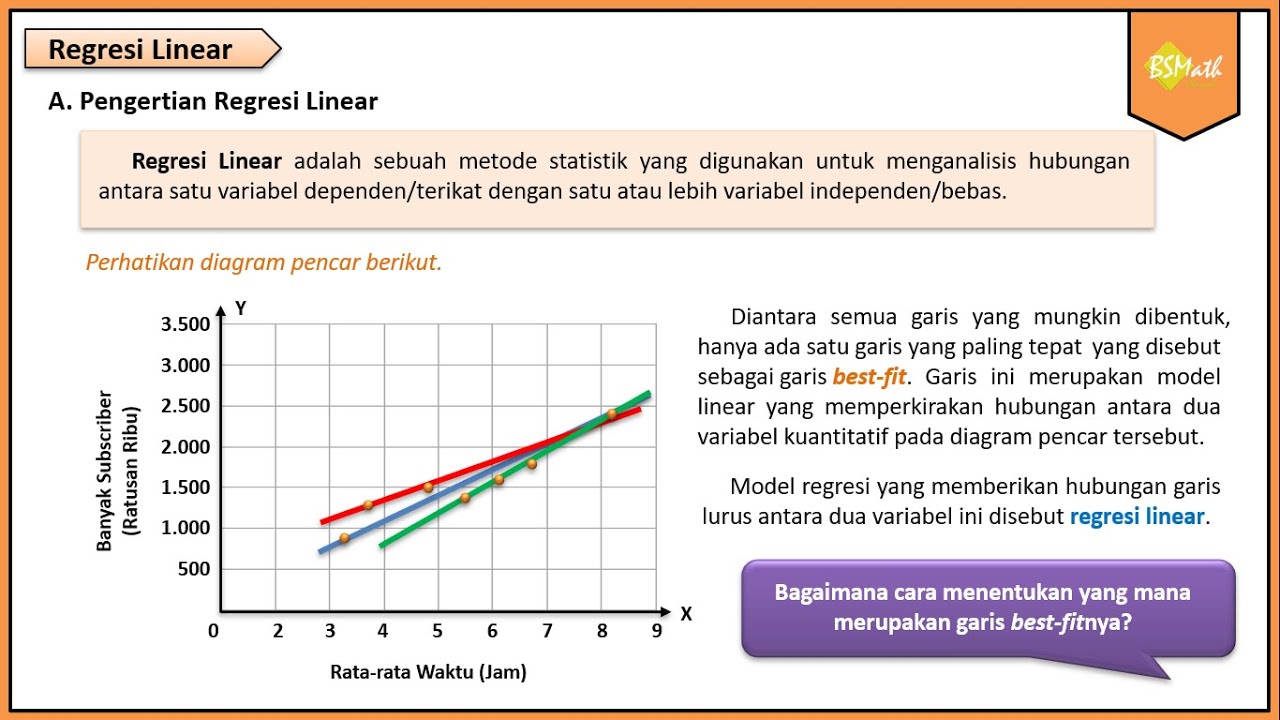
Pengertian Regresi Linear - Matematika Wajib Kelas XI Kurikulum Merdeka

Metode Numerik Pertemuan Regresi Linier

Lec-4: Linear Regression📈 with Real life examples & Calculations | Easiest Explanation

REGRESSION AND CORRELATION EDDIE SEVA SEE

Metode Statistika | Analisis Regresi Linier | Part 1 Menentukan Persamaan Regresi
5.0 / 5 (0 votes)