Regresion Lineal
Summary
TLDRThis video explains linear regression and the method of least squares for analyzing the relationship between two quantitative variables. It covers how to identify linear relationships using scatter plots and the correlation coefficient. The method of least squares is introduced to find the best-fitting line that minimizes the errors between data points. Key concepts such as interpreting the slope and intercept of the regression line are explored, along with practical guidance on using software like R and Excel to compute and plot the regression line. The video offers a comprehensive guide to understanding and applying linear regression.
Takeaways
- 😀 A scatter plot can help identify a linear relationship between two quantitative variables.
- 😀 The correlation coefficient is essential for confirming the strength and direction of a linear relationship.
- 😀 The least squares method is used to find the regression line that best fits the data points.
- 😀 The equation of a regression line is y = a + b * x, where 'a' is the intercept and 'b' is the slope.
- 😀 The slope 'b' indicates the change in 'y' for each unit change in 'x'.
- 😀 A positive slope means that as 'x' increases, 'y' also increases, and vice versa for a negative slope.
- 😀 The regression line minimizes the sum of the squared vertical distances (errors) between data points and the line.
- 😀 The error in regression is the difference between the observed and estimated values of 'y'.
- 😀 To determine the regression line, you need the means and standard deviations of both variables, as well as the correlation coefficient.
- 😀 In practice, tools like R and Excel are used to calculate the regression line and its equation.
- 😀 The regression line summarizes the relationship between an independent variable 'x' and a dependent variable 'y'.
Q & A
What is the purpose of a scatter plot in linear regression?
-A scatter plot visually helps identify the type of relationship between two quantitative variables. It allows us to detect whether there is a linear relationship, which can be either positive or negative, based on the arrangement of data points.
How does the correlation coefficient relate to linear regression?
-The correlation coefficient quantifies the strength and direction of the linear relationship between two variables. A strong correlation confirms the existence of a linear relationship, which is essential for performing linear regression.
What is the method used to find the regression line?
-The least squares method is used to determine the regression line. It minimizes the sum of squared vertical distances (errors) between the data points and the line of best fit, ensuring the line best represents the data.
What does the slope of the regression line represent?
-The slope (b) of the regression line represents the change in the dependent variable (y) for every one-unit change in the independent variable (x). A positive slope indicates an increase in y as x increases, while a negative slope indicates a decrease.
What is the equation of a regression line?
-The equation of a regression line is given by y = a + b * x, where y is the dependent variable, x is the independent variable, a is the y-intercept, and b is the slope of the line.
How can you calculate the slope (b) of the regression line?
-The slope (b) is calculated using the formula: b = r * (σy / σx), where r is the correlation coefficient, σy is the standard deviation of y, and σx is the standard deviation of x.
What does the y-intercept (a) represent in the regression equation?
-The y-intercept (a) is the value of y when x is zero. It is the point where the regression line crosses the y-axis, and it is calculated as a = ȳ - b * x̄, where ȳ and x̄ are the means of y and x, respectively.
What does the error term (y - ŷ) represent in regression analysis?
-The error term (y - ŷ) represents the difference between the observed value (y) and the estimated value (ŷ) predicted by the regression line. It is the vertical distance between a data point and the regression line.
What values are needed to calculate the regression line manually?
-To calculate the regression line manually, you need the means of x and y, the standard deviations of x and y, and the correlation coefficient between x and y.
What tools can be used to determine the regression equation in practice?
-In practice, software like R and spreadsheet tools (similar to Excel) are commonly used to determine the regression equation. These tools simplify the calculation process and provide a more efficient way to compute the line of best fit.
Outlines

This section is available to paid users only. Please upgrade to access this part.
Upgrade NowMindmap

This section is available to paid users only. Please upgrade to access this part.
Upgrade NowKeywords

This section is available to paid users only. Please upgrade to access this part.
Upgrade NowHighlights

This section is available to paid users only. Please upgrade to access this part.
Upgrade NowTranscripts

This section is available to paid users only. Please upgrade to access this part.
Upgrade NowBrowse More Related Video
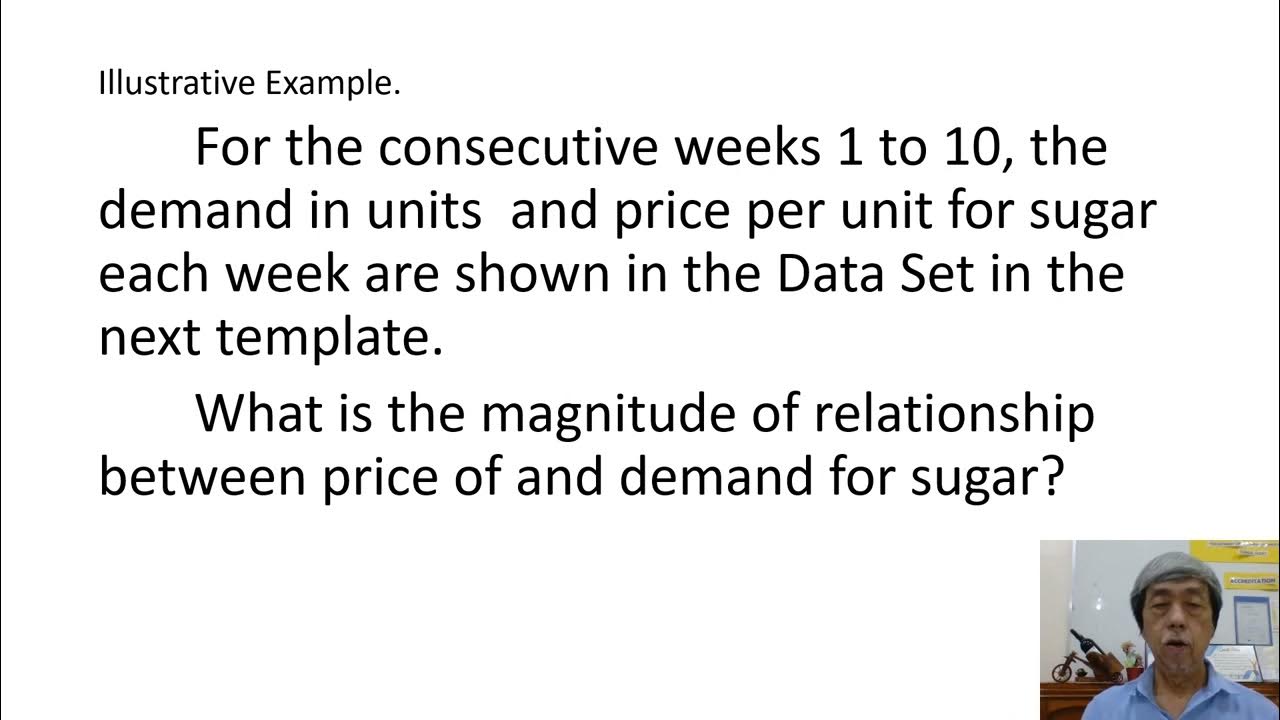
REGRESSION AND CORRELATION EDDIE SEVA SEE
Modul 12 (StatSos2) - Konsep Dasar Regresi Linear Sederhana
35. Regressione Lineare Semplice (Spiegata passo dopo passo)
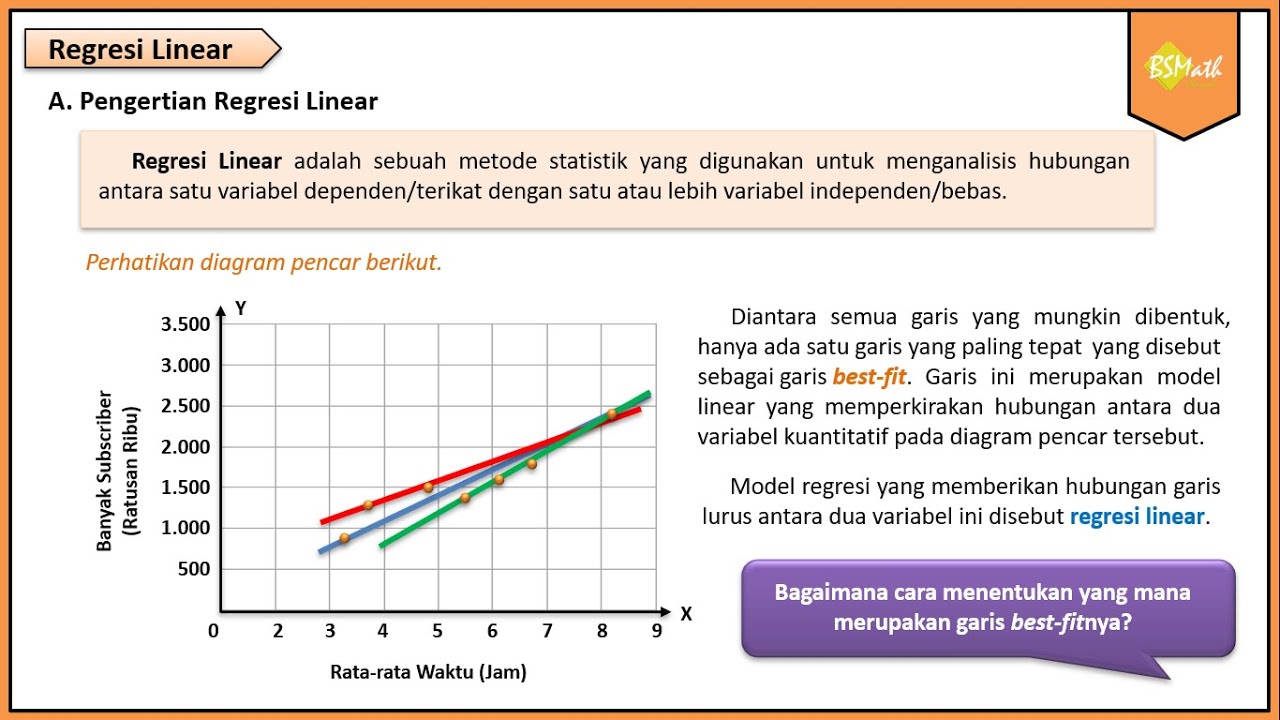
Pengertian Regresi Linear - Matematika Wajib Kelas XI Kurikulum Merdeka

Lec-4: Linear Regression📈 with Real life examples & Calculations | Easiest Explanation

La régression linéaire, quelques explications
5.0 / 5 (0 votes)