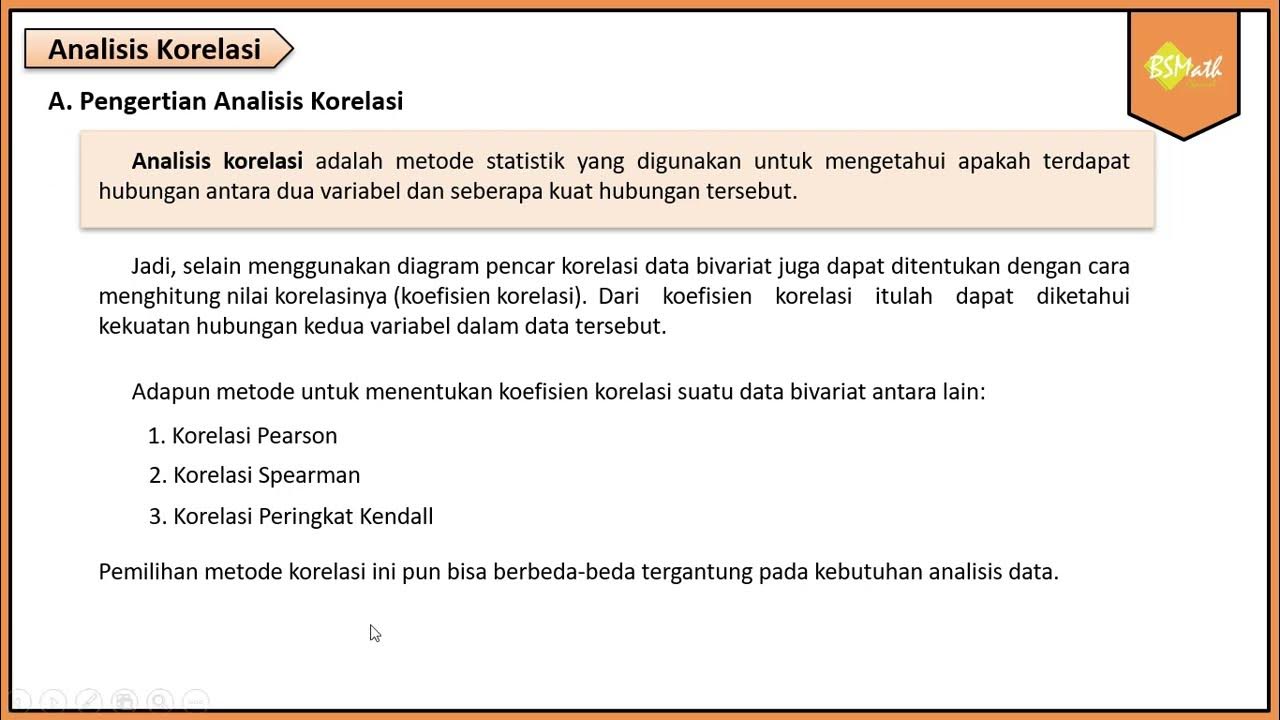
Korelasi Product Moment (r) Hal 110-116 Bab 3 STATISTIK Kelas 11 SMA Kurikulum Merdeka
Summary
TLDRThis lesson focuses on teaching students about Pearson’s Product Moment Correlation Coefficient, a statistical concept used to measure the strength and direction of the relationship between two variables. The video explains the formulas for calculating the sum of squares and introduces how to interpret the correlation coefficient (r), including its positive, negative, or zero correlation. Visual aids like scatter plots help in understanding the correlation strength. The lesson concludes with real-world applications and practical exercises to explore relationships between variables, such as height and weight or altitude and temperature.
Takeaways
- 😀 Pearson's Product Moment Correlation (R) is a statistical method used to measure the strength and direction of the linear relationship between two variables.
- 😀 The formula for Pearson's correlation coefficient (R) involves calculating the sum of squares of the differences between independent and dependent variables and their means (ssxy, ssxx, ssyy).
- 😀 The correlation coefficient (R) ranges from -1 to 1, where R = 1 indicates a perfect positive linear relationship, R = -1 indicates a perfect negative linear relationship, and R = 0 indicates no linear relationship.
- 😀 When R is closer to 1 or -1, the relationship between variables is stronger. When R is closer to 0, the relationship is weaker or nonexistent.
- 😀 A positive correlation means that as one variable increases, the other also increases, and vice versa. An example is the positive correlation between height and weight.
- 😀 A negative correlation means that as one variable increases, the other decreases. An example is the negative correlation between altitude and temperature.
- 😀 A strong positive correlation shows data points clustered closely around a regression line, while a weak positive correlation shows more scattered data points.
- 😀 A strong negative correlation has data points closely following a downward regression line, while a weak negative correlation has scattered points further from the line.
- 😀 The correlation coefficient (R) can be interpreted as follows: values between 0 and 0.3 (or -0.3 to 0) indicate weak correlation, 0.3 to 0.7 (or -0.7 to -0.3) indicate moderate correlation, and 0.7 to 1 (or -1 to -0.7) indicate strong correlation.
- 😀 In real-life applications, understanding the correlation between two variables can help in making predictions, such as predicting weight based on height or understanding the effect of altitude on temperature.
Q & A
What is Person's Product Moment Correlation?
-Person's Product Moment Correlation (also known as Pearson's correlation) is a statistical method used to measure the strength and direction of the linear relationship between two variables. It is represented by the coefficient 'R', which ranges from -1 to 1.
What are the key formulas used to calculate Person's Product Moment Correlation?
-The key formulas are: 1. SSxy = Σ(x - x̄)(y - ȳ) 2. SSxx = Σ(x - x̄)² 3. SSyy = Σ(y - ȳ)² Then, the correlation coefficient R is calculated as: R = SSxy / √(SSxx * SSyy)
What does a correlation coefficient value of 1 or -1 signify?
-A correlation coefficient of 1 indicates a perfect positive correlation, where both variables move in the same direction, while -1 indicates a perfect negative correlation, where one variable increases as the other decreases.
What does a correlation coefficient of 0 mean?
-A correlation coefficient of 0 means there is no linear relationship between the two variables; their relationship cannot be described by a straight line.
How can we interpret values of R between 0 and 1, or between -1 and 0?
-Values of R between 0 and 1 indicate a positive correlation, with values closer to 1 signifying a stronger relationship. Values between -1 and 0 indicate a negative correlation, with values closer to -1 representing a stronger inverse relationship.
What is the significance of a scatter plot in analyzing correlation?
-A scatter plot visually represents the relationship between two variables. The pattern of data points helps determine the strength and direction of the correlation. For example, points along a line suggest a strong correlation, while scattered points indicate a weak correlation.
What are the different strengths of correlation as defined by R values?
-R values are categorized as: - Strong correlation: |R| ≥ 0.7 - Moderate correlation: 0.3 ≤ |R| < 0.7 - Weak correlation: |R| < 0.3 - No correlation: R = 0
Can a correlation coefficient determine causality between two variables?
-No, a correlation coefficient only measures the strength and direction of a linear relationship between two variables. It does not imply causality. Other factors or variables could be responsible for the observed relationship.
What example is given for positive correlation in the transcript?
-An example of positive correlation mentioned in the transcript is the relationship between height and weight, where taller people tend to have a higher weight.
What real-life scenario is used to illustrate negative correlation?
-The transcript uses the example of altitude and temperature to illustrate negative correlation. As altitude increases (such as when climbing a mountain), the temperature tends to decrease.
Outlines

Cette section est réservée aux utilisateurs payants. Améliorez votre compte pour accéder à cette section.
Améliorer maintenantMindmap

Cette section est réservée aux utilisateurs payants. Améliorez votre compte pour accéder à cette section.
Améliorer maintenantKeywords

Cette section est réservée aux utilisateurs payants. Améliorez votre compte pour accéder à cette section.
Améliorer maintenantHighlights

Cette section est réservée aux utilisateurs payants. Améliorez votre compte pour accéder à cette section.
Améliorer maintenantTranscripts

Cette section est réservée aux utilisateurs payants. Améliorez votre compte pour accéder à cette section.
Améliorer maintenantVoir Plus de Vidéos Connexes

[Tagalog] Pearson (r) Product Moment Correlation Coefficient - Computation and Interpretation

Pearson correlation [Simply explained]

KULIAH STATISTIK - ANALISIS KORELASI

Spearmen's Rank Correlation || Gnani The Knowledge ||

CORRELATION || MATHEMATICS IN THE MODERN WORLD

Analisis Korelasi - Matematika Wajib SMA Kelas XI Kurikulum Merdeka
5.0 / 5 (0 votes)
