STATISTIKA - Penyajian Data dengan SPSS untuk Pemula
Summary
TLDRIn this tutorial, the instructor teaches how to present data using SPSS version 25, focusing on variables like gender, study hours, knowledge score, and skill score. The video explains the process of setting up variables in SPSS, entering data, and performing descriptive statistical analysis. Key steps include labeling data, selecting appropriate scales for each variable, and visualizing data with frequency distributions, pie charts, histograms, and other descriptive statistics. The instructor also demonstrates how to interpret the results and save the output for future reference, offering a comprehensive guide to data presentation using SPSS.
Takeaways
- 😀 SPSS version 25 is used to analyze and present data.
- 😀 Gender is recorded as a nominal variable with values 1 for male and 2 for female.
- 😀 Study hours are an ordinal variable ranging from 1 to 5 hours, indicating the rank of study time.
- 😀 Knowledge and skill scores are ratio/interval variables, depending on whether the zero represents an absolute absence of skill or knowledge.
- 😀 In SPSS, data entry is done in the 'Variable View' and 'Data View' windows.
- 😀 For categorical variables, value labels (e.g., Male = 1, Female = 2) are set in the 'Value' column.
- 😀 The 'Descriptive Statistics' feature in SPSS provides options to calculate frequency, percentage, and cumulative percentage.
- 😀 Visual representations of data like bar charts and histograms can be created using SPSS.
- 😀 Frequency distributions in SPSS can be exported into Microsoft Word for easy documentation and reporting.
- 😀 SPSS automatically calculates various statistical measures, such as mean, minimum, and maximum values, for the data.
- 😀 Users can save both the dataset and the output generated from SPSS for future use or further analysis.
Q & A
What is the purpose of this lesson?
-The purpose of the lesson is to teach how to present data using SPSS version 25, covering various variables and statistical techniques for data analysis.
What types of variables are included in the data set?
-The data set includes variables such as gender, hours of study, knowledge score, and skill score. These variables represent different types of scales: nominal, ordinal, and ratio.
How is gender coded in the data set?
-Gender is coded as '1' for male and '2' for female. This is considered a nominal scale, where the values do not have a quantitative meaning but are used to distinguish categories.
What type of scale is used for hours of study?
-Hours of study are represented on an ordinal scale. The values (1 to 5) indicate ranking or the number of hours, with 1 being the least and 5 being the most.
How are knowledge and skill scores categorized in terms of scale?
-Knowledge and skill scores are typically on a ratio scale, assuming a true zero value. However, if there is no true zero, they are considered interval scales.
What is the first step in preparing data in SPSS?
-The first step is to enter the variable definitions in the 'Variable View' of SPSS, including the variable names, labels, and the appropriate scales (nominal, ordinal, or ratio).
Why are decimal places set to zero for certain variables in SPSS?
-Decimal places are set to zero for variables like gender and hours of study, where there is no need for fractional values. This ensures that the data is presented cleanly without unnecessary decimal places.
What is the purpose of the 'Value' setting in SPSS?
-The 'Value' setting in SPSS is used to define the labels for specific numeric codes. For example, '1' can be labeled as 'Male' and '2' as 'Female' for the gender variable.
How is descriptive statistics used in SPSS?
-Descriptive statistics are used in SPSS to summarize and describe the main features of the data. This includes calculating frequencies, percentages, means, and other measures for the variables.
What are some visualizations that can be generated from the data in SPSS?
-SPSS allows the generation of various visualizations, such as pie charts, histograms, and bar charts, to visually represent the data and distribution of values across different variables.
Outlines

Cette section est réservée aux utilisateurs payants. Améliorez votre compte pour accéder à cette section.
Améliorer maintenantMindmap

Cette section est réservée aux utilisateurs payants. Améliorez votre compte pour accéder à cette section.
Améliorer maintenantKeywords

Cette section est réservée aux utilisateurs payants. Améliorez votre compte pour accéder à cette section.
Améliorer maintenantHighlights

Cette section est réservée aux utilisateurs payants. Améliorez votre compte pour accéder à cette section.
Améliorer maintenantTranscripts

Cette section est réservée aux utilisateurs payants. Améliorez votre compte pour accéder à cette section.
Améliorer maintenantVoir Plus de Vidéos Connexes
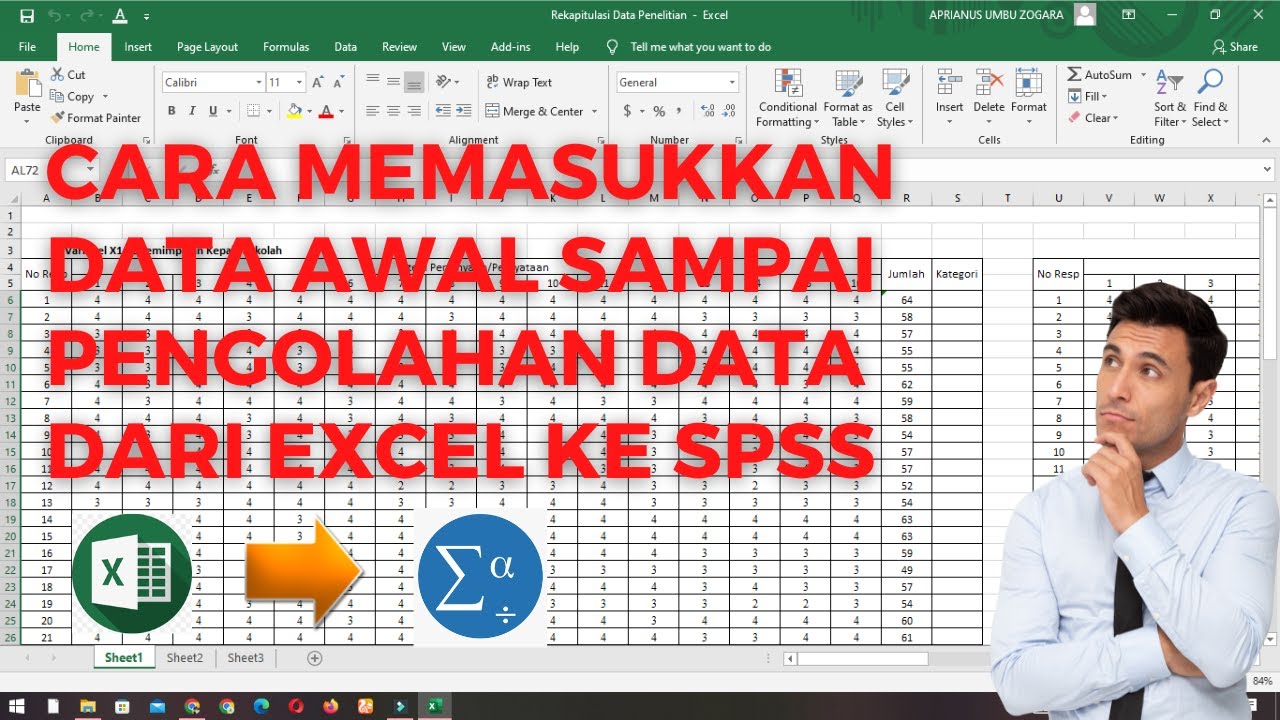
Cara Memasukkan Data Awal Sampai Pengolahan Data dari Excel ke SPSS
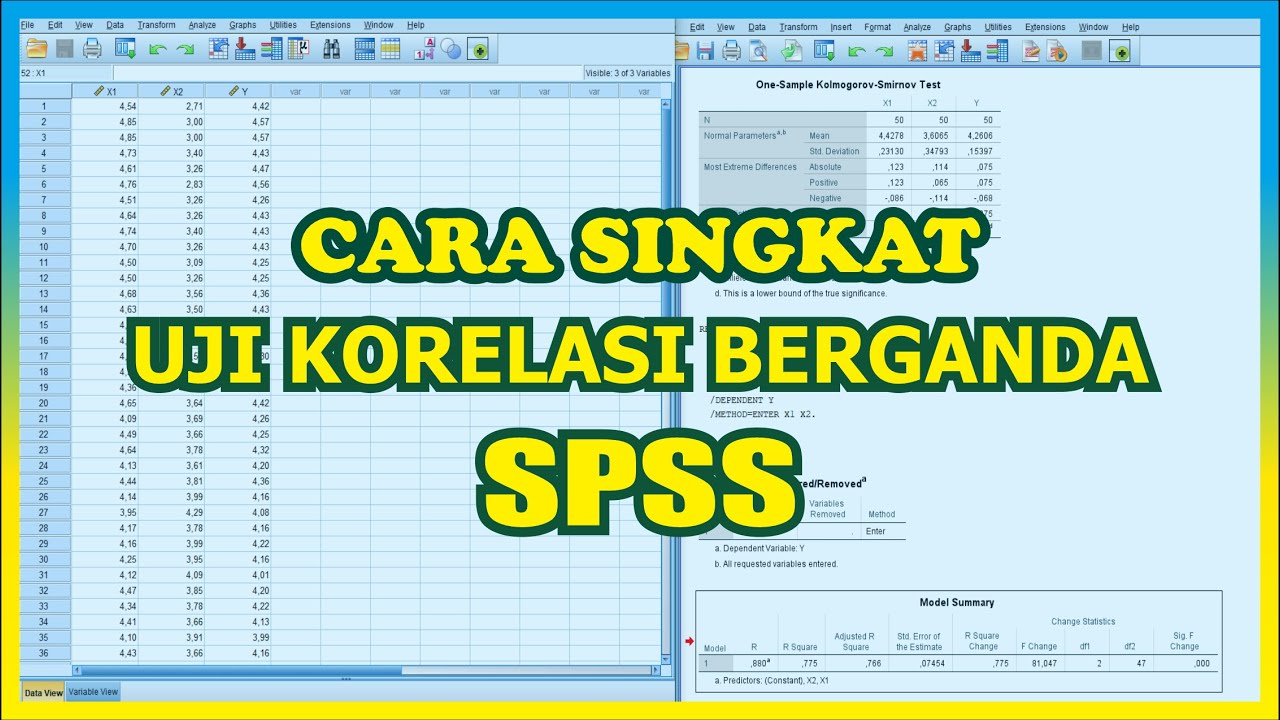
TUTORIAL SPSS : Multiple Correlation Test SPSS
Learn SPSS in 15 minutes
Penyajian Data Statistik Menggunakan SPSS

CARA ANALISIS DESKRIPTIF KARAKTERISTIK RESPONDEN PENELITIAN DENGAN SPSS
MEMULAI SPSS: MEMBUAT VARIABLE, DATA ENTRY DAN NALISIS DATA DESKRIPTIF
5.0 / 5 (0 votes)
