Learn SPSS in 15 minutes
Summary
TLDRThis video provides a step-by-step guide to using SPSS in under 15 minutes. The instructor covers essential tasks, including defining variables, entering data, and performing basic data analysis with descriptive statistics like frequencies and summary statistics. Key concepts such as variable types (nominal, ordinal, and scale), creating variables, assigning labels, and generating bar charts and histograms are explained. The video also offers practical examples using gender, age, and survey responses to demonstrate how SPSS handles data analysis. The tutorial concludes with a basic analysis of data distribution and statistical measures.
Takeaways
- 😀 SPSS has an interface that resembles a spreadsheet, similar to Microsoft Excel, with two views: Data View and Variable View.
- 📊 Variable names in SPSS must not contain spaces or special characters.
- 🔢 Variables can be defined by type, such as numeric or string, depending on the nature of the data (e.g., numeric for interview IDs, string for names).
- 📋 SPSS supports different levels of measurement for variables, such as scale, ordinal, and nominal.
- 📝 For categorical data like gender, numeric values can be assigned (e.g., 1 for male, 2 for female).
- 📐 Measurement levels determine how data is interpreted. For instance, scale variables represent quantities, ordinal variables represent ordered categories, and nominal variables represent categories without order.
- 📊 SPSS allows for the analysis of data through descriptive statistics such as frequencies, means, and standard deviations.
- 📉 Charts, such as bar charts for categorical data and histograms for continuous data, can be created for data visualization.
- 📄 SPSS provides various statistical options like mean, median, range, and standard deviation to summarize continuous data.
- 📈 Frequency tables are useful for categorical data, but not for continuous data with many unique values.
Q & A
What is the main objective of the video tutorial?
-The main objective of the video is to introduce and teach the basics of using SPSS within 15 minutes, covering topics such as defining variables, entering data, and analyzing data using descriptive statistics.
What are the two primary views in SPSS, and what are they used for?
-The two primary views in SPSS are the Data View and the Variable View. The Data View is where you enter and see the actual data, while the Variable View is used to define and edit the variables (questions) in your survey or questionnaire.
What is the rule for naming variables in SPSS?
-Variable names in SPSS should not include any spaces, symbols, or special characters.
How can you specify the data type of a variable in SPSS?
-You can specify the data type of a variable in SPSS by clicking on the 'Type' button next to the variable name and choosing the appropriate format (e.g., numeric or string).
What are the three measurement levels used in SPSS, and how are they defined?
-The three measurement levels used in SPSS are: (1) Scale: Variables that represent quantities, such as age or distance. (2) Ordinal: Variables that are represented by words where one value is higher in rank or quality than another, such as education levels. (3) Nominal: Variables represented by words where no particular value has more of the characteristic than another, such as gender or religious affiliation.
What is a nominal variable, and can you provide an example?
-A nominal variable is a variable represented by categories where no category is higher or lower in terms of quantity or quality compared to others. An example is gender, where categories include male and female.
How do you set up a multiple-choice variable like 'gender' in SPSS?
-To set up a multiple-choice variable like 'gender,' you should define it as a numeric variable and then specify the values to represent each choice. For example, you can assign 1 for 'male' and 2 for 'female.'
What is the function of the 'Value Labels' button in SPSS?
-The 'Value Labels' button in SPSS allows you to see the labels for variables with specified values (like 1 = male, 2 = female) instead of showing the numeric codes.
Which SPSS function would you use to get a summary of categorical variables, and why?
-You would use the 'Frequencies' function in SPSS to get a summary of categorical variables because it shows how many times each value appears, which is useful for variables with a few distinct categories.
What type of graph is recommended for continuous variables like 'age' in SPSS, and why?
-A histogram is recommended for continuous variables like 'age' because it visually represents the distribution of the data and can include a normal curve to show how the data is distributed around the mean.
Outlines

This section is available to paid users only. Please upgrade to access this part.
Upgrade NowMindmap

This section is available to paid users only. Please upgrade to access this part.
Upgrade NowKeywords

This section is available to paid users only. Please upgrade to access this part.
Upgrade NowHighlights

This section is available to paid users only. Please upgrade to access this part.
Upgrade NowTranscripts

This section is available to paid users only. Please upgrade to access this part.
Upgrade NowBrowse More Related Video
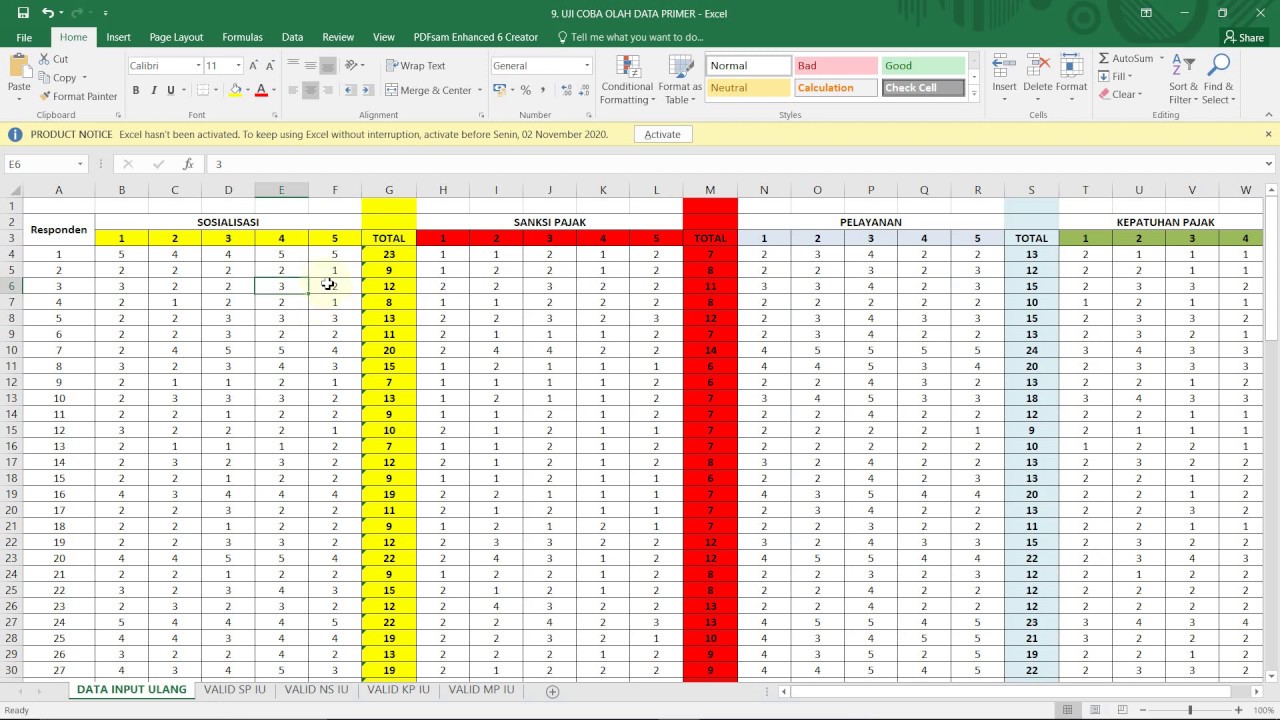
BELAJAR UJI VALIDITAS DAN RELIABILITAS DATA PRIMER DENGAN SPSS (Bagian 1)
FÁCIL e RÁPIDO | MEDIDAS DE COMPRIMENTO
Durbin Watson Autocorrelation Test SPSS – Classic Assumption Test

Uji Regresi Linier Sederhana Dengan SPSS | Pembahasan Lengkap!
MEMBUKA FILE EXCEL MENGGUNAKAN SPSS
BAB V STATISTIKA NON PARAMETRIK|INDEPENDENT SAMPLE|STATISTIKA TERAPAN|Part II
5.0 / 5 (0 votes)