MEMULAI SPSS: MEMBUAT VARIABLE, DATA ENTRY DAN NALISIS DATA DESKRIPTIF
Summary
TLDRThis video provides a beginner-friendly guide to using SPSS for data analysis. It covers the essential steps including setting up variables, entering data, and performing data cleaning. The tutorial explains how to create and manage variables such as age, gender, and pre- and post-surgery pulse data. The presenter walks through basic data entry, conducting descriptive statistics, and analyzing frequency distributions. The video concludes by demonstrating how to calculate average values and understand results, offering practical tips for students and professionals starting with SPSS.
Takeaways
- 😀 SPSS is a widely used program for data analysis and handling, with various steps to follow.
- 😀 To start with SPSS, first, install and open the program, then set up the 'Variable View' and 'Data View'.
- 😀 The 'Variable View' is where you create and define variables, while the 'Data View' is for entering the data.
- 😀 Data cleaning is crucial for ensuring that the data is accurate and complete before analysis.
- 😀 SPSS can handle both descriptive and inferential statistics, which help in analyzing the data according to specific research objectives.
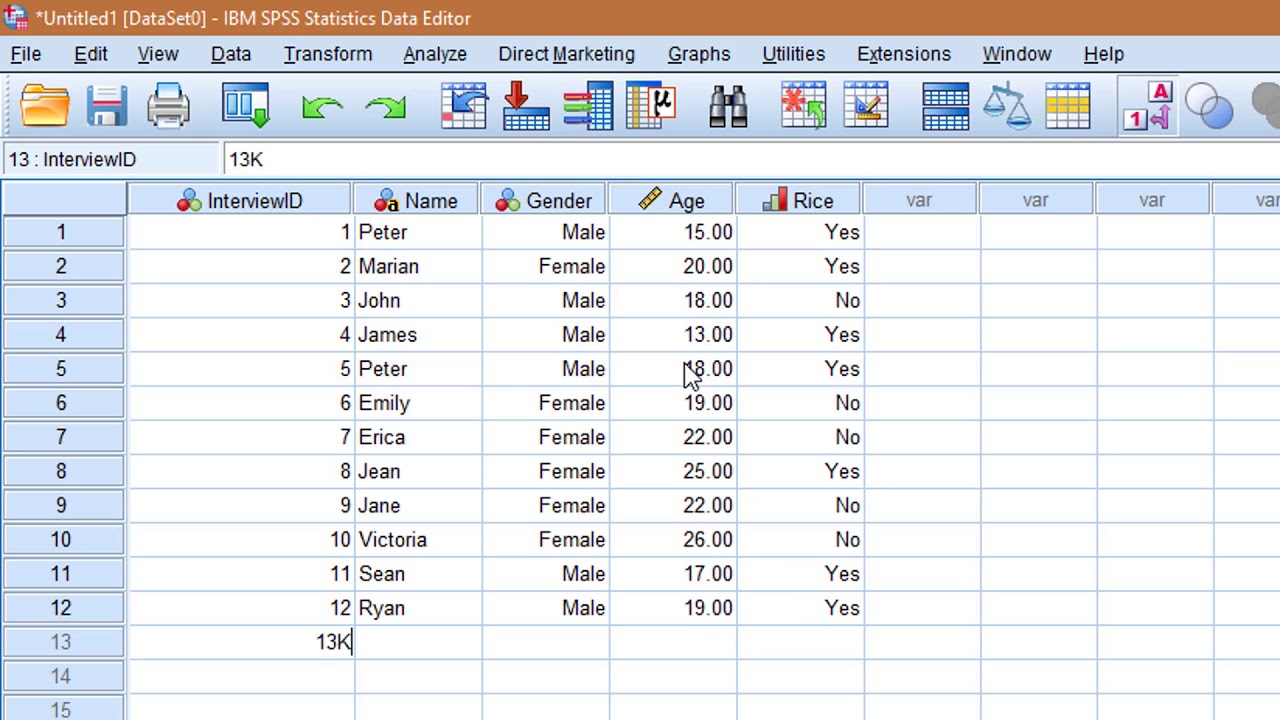
- 😀 Example variables include heart rate measurements before and after surgery, patient age, and gender.
- 😀 New variables can be added easily in the 'Variable View', such as age and gender, which may be categorized for analysis.
- 😀 Data can be entered manually in the 'Data View', with each respondent's data corresponding to the variables defined earlier.
- 😀 After entering the data, descriptive statistics such as frequency distributions, mean, median, and standard deviation can be computed.
- 😀 SPSS allows you to test the significance of your findings using inferential statistics, to understand whether observed changes are statistically meaningful.
- 😀 The script provides a simplified step-by-step guide on how to start working with SPSS, from entering data to performing basic statistical analysis.
Q & A
What is SPSS used for?
-SPSS (Statistical Package for the Social Sciences) is used for data processing and statistical analysis. It allows users to analyze data, generate statistical reports, and visualize results in various formats.
What are the first steps in using SPSS?
-The first steps include installing SPSS on your computer, then launching the program. After that, you should create and define variables in the 'Variable View' and input data in the 'Data View' for analysis.
What is the 'Variable View' in SPSS?
-'Variable View' in SPSS is the section where users define and set up the variables for their study. It includes naming the variables and specifying their characteristics such as type, width, and measurement scale.
What is the purpose of 'Data View' in SPSS?
-'Data View' is where data is entered after defining the variables in 'Variable View'. It's used for inputting values for each observation, corresponding to the variables that have been set up.
Why is data cleaning important in SPSS?
-Data cleaning ensures that the data entered into SPSS is accurate, complete, and free of errors. This step is crucial to ensure that the results of any analysis are reliable and meaningful.
How do you input data into SPSS?
-To input data, you first define the variables in 'Variable View' and then enter the corresponding data in 'Data View'. You can add data row by row for each observation, ensuring that it aligns with the defined variables.
What types of data can be entered in SPSS?
-SPSS can handle various types of data, including numerical, categorical, and ordinal data. Examples include continuous variables like age, and categorical variables like gender or satisfaction levels.
How do you add a new variable in SPSS?
-To add a new variable, go to the 'Variable View', insert a new row, and define the variable name, type, and properties such as measurement scale. Then, you can input data related to the new variable in 'Data View'.
What is statistical descriptive analysis in SPSS?
-Statistical descriptive analysis in SPSS summarizes data through metrics like mean, median, mode, standard deviation, and frequency distributions. It provides a snapshot of the dataset’s characteristics.
How can you calculate the average age of patients using SPSS?
-To calculate the average age, go to 'Analyze' > 'Descriptive Statistics' > 'Descriptives', select the 'Age' variable, and click 'OK'. SPSS will compute and display the mean (average) age along with other statistics.
Outlines

This section is available to paid users only. Please upgrade to access this part.
Upgrade NowMindmap

This section is available to paid users only. Please upgrade to access this part.
Upgrade NowKeywords

This section is available to paid users only. Please upgrade to access this part.
Upgrade NowHighlights

This section is available to paid users only. Please upgrade to access this part.
Upgrade NowTranscripts

This section is available to paid users only. Please upgrade to access this part.
Upgrade NowBrowse More Related Video

Introduction to SPSS Software for Beginners (Part 1)

PENGENALAN DASAR SPSS (PART 1)
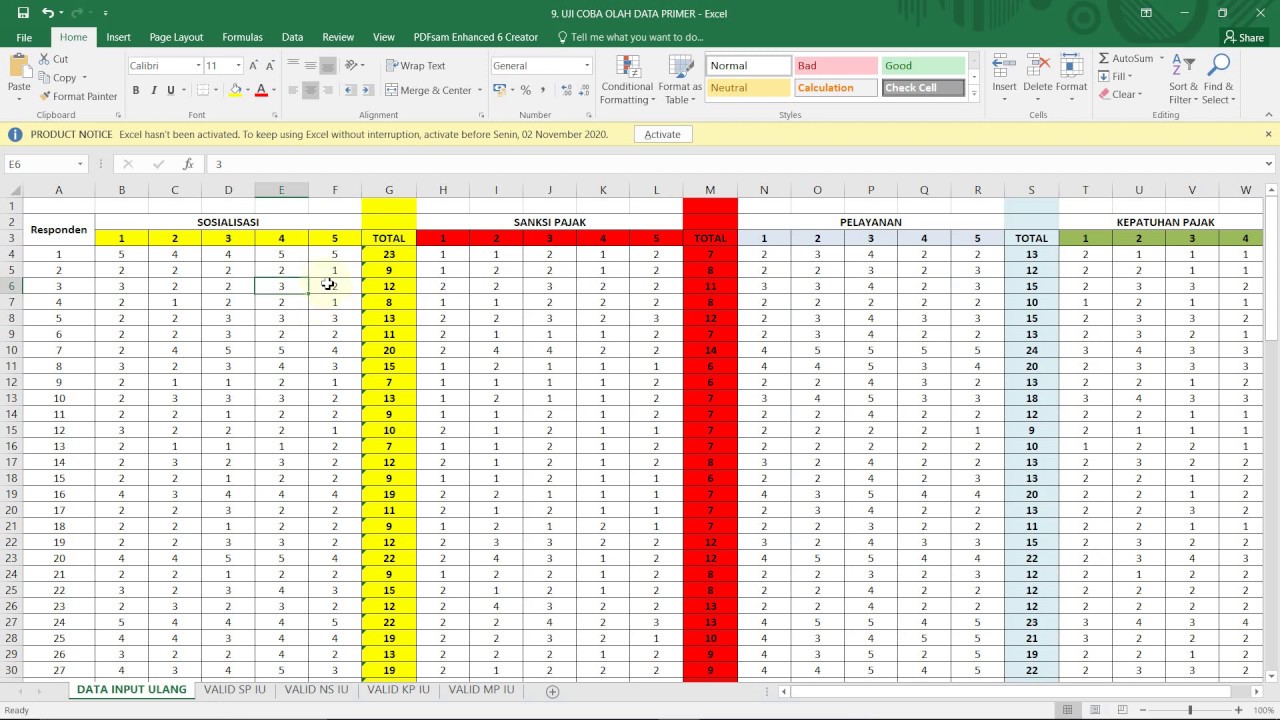
BELAJAR UJI VALIDITAS DAN RELIABILITAS DATA PRIMER DENGAN SPSS (Bagian 1)
Learn SPSS in 15 minutes
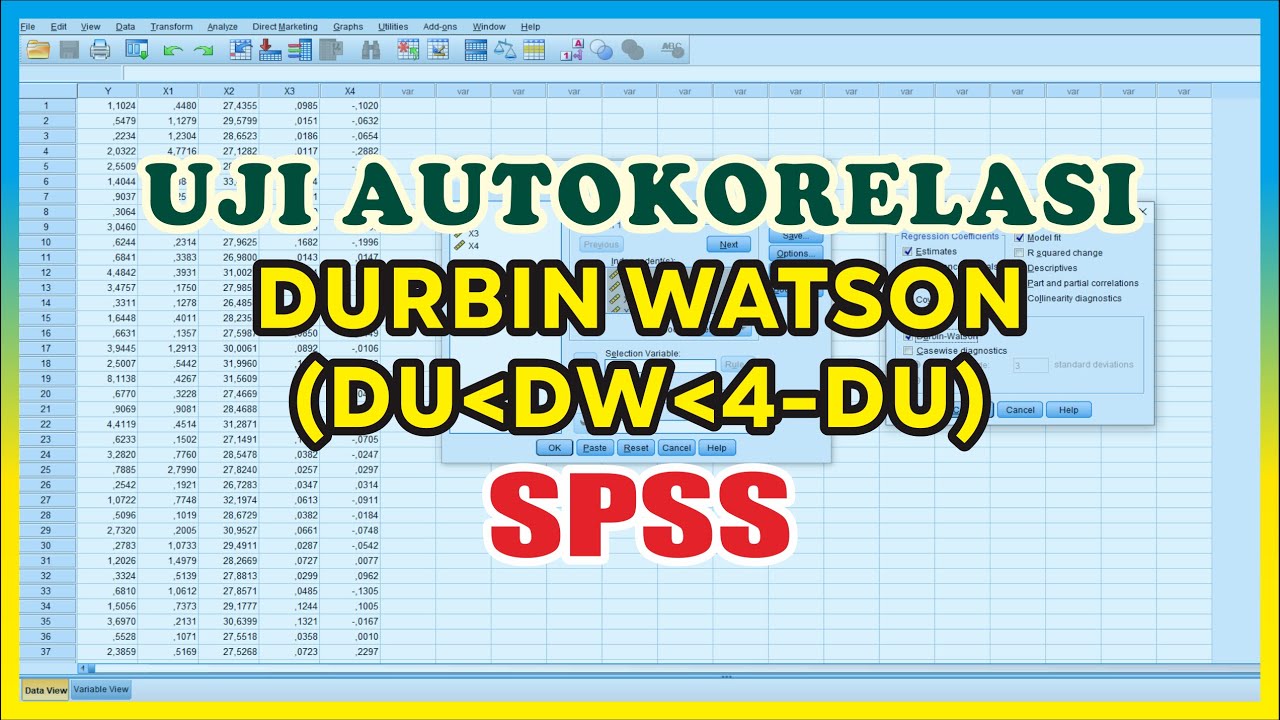
Durbin Watson Autocorrelation Test SPSS – Classic Assumption Test
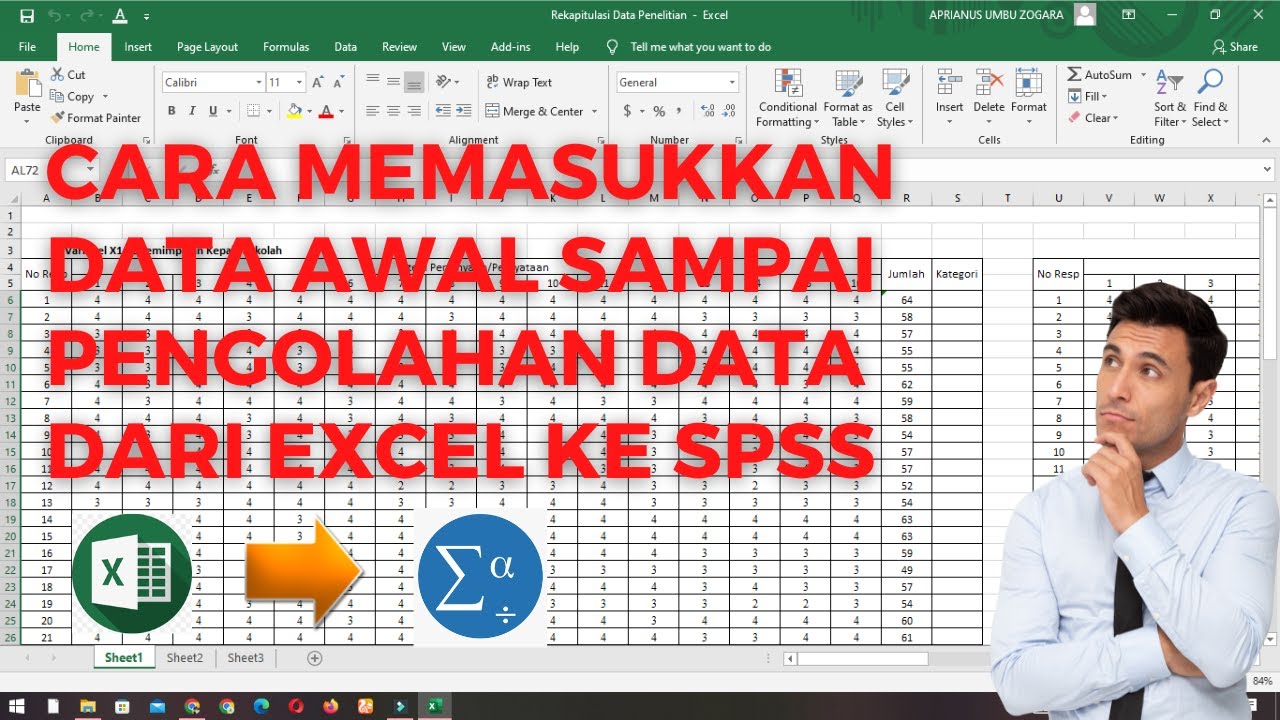
Cara Memasukkan Data Awal Sampai Pengolahan Data dari Excel ke SPSS
5.0 / 5 (0 votes)