APA ITU KOEFISIEN DETERMINASI (r²) ? | CONTOH DAN PEMBAHASAN PADA OUTPUT SPSS #StudyWithTika
Summary
TLDRIn this video, Rizki Atika explains the concept of the coefficient of determination (R-squared) in multiple linear regression. The R-squared value represents the ability of independent variables to explain the variance in a dependent variable. The video also addresses the limitations of R-squared, such as its tendency to increase with the addition of more independent variables, even if they have no actual correlation with the dependent variable. To solve this, the adjusted R-squared is introduced as a better measure. Additionally, viewers are reminded that a negative R-squared value is treated as zero, indicating no explanatory power.
Takeaways
- 😀 The coefficient of determination (R-squared) measures how well independent variables explain the variance in the dependent variable in multiple linear regression.
- 😀 R-squared is the square of the correlation coefficient (R), and it ranges from 0 to 1. For example, an R value of 0.8 results in an R-squared of 0.64.
- 😀 R-squared indicates the proportion of variance in the dependent variable that can be explained by the independent variables in the model.
- 😀 A high R-squared value means that a large portion of the variance is explained by the model, while a lower R-squared indicates less explanatory power.
- 😀 Adding more independent variables to the model generally increases R-squared, even if the new variables do not have a meaningful relationship with the dependent variable.
- 😀 Adjusted R-squared is used to address the issue of R-squared increasing simply by adding more variables. It accounts for the number of variables and ensures only relevant ones improve the model.
- 😀 The main advantage of Adjusted R-squared is that it provides a more accurate measure of the model's explanatory power by considering the significance of each variable.
- 😀 If the R-squared value is negative, it indicates that the model is performing worse than a basic mean model, and such negative values are treated as zero.
- 😀 R-squared values close to 1 indicate a strong fit between the model and the data, but a high R-squared alone doesn't guarantee the model is appropriate.
- 😀 The video encourages viewers to watch related content, especially on the correlation coefficient, to fully understand the relationship between variables in regression analysis.
Q & A
What is the coefficient of determination in multiple linear regression?
-The coefficient of determination in multiple linear regression is a measure of how well all independent variables explain the variance in the dependent variable. It is often symbolized as R-squared (R²).
What does R-squared (R²) represent in regression analysis?
-R-squared represents the proportion of variance in the dependent variable that is explained by the independent variables in the model. A higher R² indicates better explanatory power of the model.
Why is it important to understand the correlation coefficient before discussing the coefficient of determination?
-It is important because the coefficient of determination is the square of the correlation coefficient. Understanding the correlation coefficient (r) helps explain how it leads to the R-squared value, which shows the strength of the relationship.
How is the coefficient of determination calculated from the correlation coefficient?
-The coefficient of determination (R²) is calculated by squaring the correlation coefficient (r). For example, if the correlation coefficient is 0.8, the R-squared value is 0.64 (0.8 * 0.8).
What does an R-squared value of 0.64 indicate?
-An R-squared value of 0.64 means that 64% of the variance in the dependent variable is explained by the independent variables in the model, while the remaining 36% is explained by factors outside the model.
What is the range of values for R-squared (R²)?
-R-squared values range from 0 to 1. A value of 1 means perfect explanatory power, while a value of 0 indicates no explanatory power.
What problem arises with R-squared when more independent variables are added to the model?
-The problem is that R-squared can increase with the addition of more independent variables, even if those variables do not have a meaningful relationship with the dependent variable, leading to potentially misleading conclusions.
Why is adjusted R-squared a better alternative than R-squared?
-Adjusted R-squared accounts for the number of independent variables in the model. It adjusts the R-squared value to reflect whether the added variables genuinely improve the model or not, preventing overestimation caused by simply adding more variables.
What does a negative R-squared value indicate?
-A negative R-squared value suggests that the model does not fit the data well and is no better than a model that simply predicts the mean of the dependent variable. In practice, negative R-squared values are interpreted as zero.
What is the importance of checking the correlation between independent variables and the dependent variable when using adjusted R-squared?
-When using adjusted R-squared, it is important to verify if the added independent variables genuinely correlate with the dependent variable. If they do not, the adjusted R-squared will not increase significantly, signaling that the variable addition was unnecessary.
Outlines

Cette section est réservée aux utilisateurs payants. Améliorez votre compte pour accéder à cette section.
Améliorer maintenantMindmap

Cette section est réservée aux utilisateurs payants. Améliorez votre compte pour accéder à cette section.
Améliorer maintenantKeywords

Cette section est réservée aux utilisateurs payants. Améliorez votre compte pour accéder à cette section.
Améliorer maintenantHighlights

Cette section est réservée aux utilisateurs payants. Améliorez votre compte pour accéder à cette section.
Améliorer maintenantTranscripts

Cette section est réservée aux utilisateurs payants. Améliorez votre compte pour accéder à cette section.
Améliorer maintenantVoir Plus de Vidéos Connexes
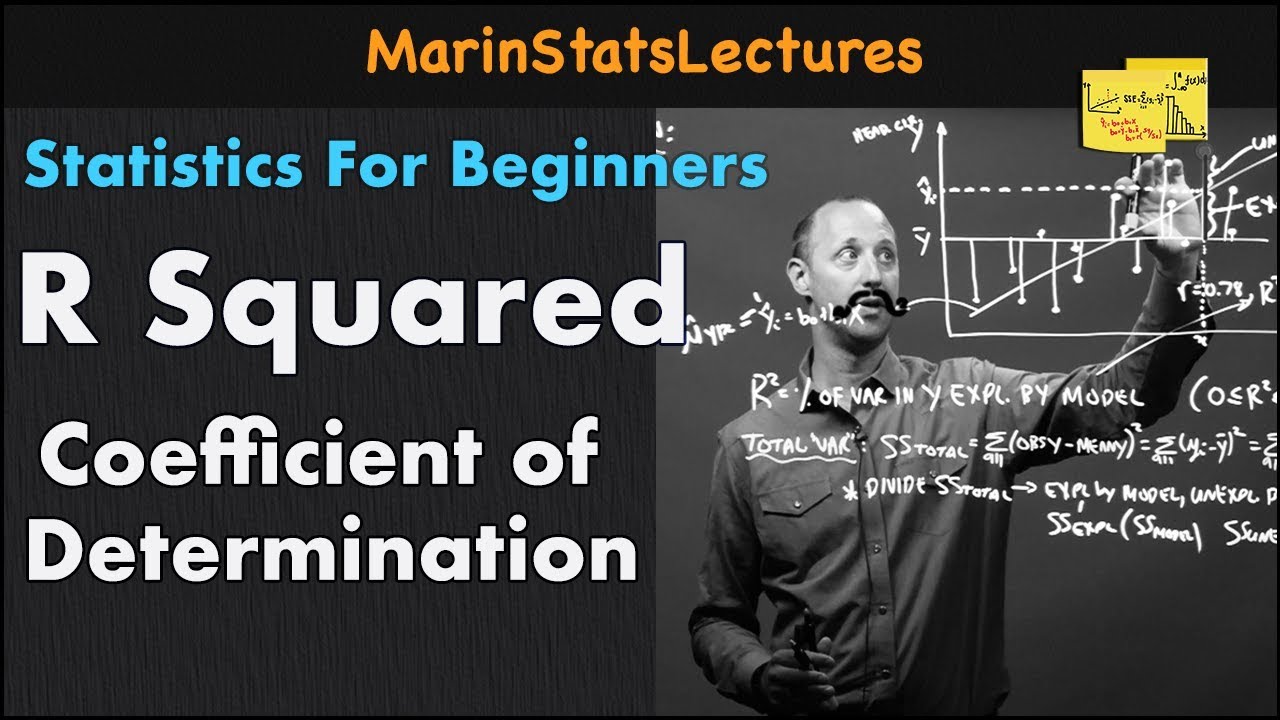
R Squared or Coefficient of Determination | Statistics Tutorial | MarinStatsLectures

APA ARTI NILAI KOEFISIEN KORELASI (r) PADA REGRESI LINIER BERGANDA ? | #StudyWithTika

Uji Regresi Linier Sederhana Dengan SPSS | Pembahasan Lengkap!
Tutorial Uji Asumsi Klasik (Prasyarat) Beserta Uji Regresi Berganda Dengan SPSS
METODE NUMERIK 11 REGRESI LINIER

Uji t dan Uji F dalam Analisis Regresi Berganda dengan SPSS Lengkap
5.0 / 5 (0 votes)
