Tutorial Uji Asumsi Klasik (Prasyarat) Beserta Uji Regresi Berganda Dengan SPSS
Summary
TLDRThis video tutorial provides an in-depth explanation of performing classical assumption tests and hypothesis testing in multiple linear regression analysis. It covers the steps for testing normality, heteroscedasticity, and multicollinearity, followed by hypothesis testing using t-tests, F-tests, and the coefficient of determination (R-squared). The script walks through each test methodically, explaining how to interpret the results from statistical software, focusing on significance values and model assumptions. By the end of the video, viewers gain a comprehensive understanding of how to conduct these tests and interpret their outcomes in research.
Takeaways
- 😀 The video discusses how to perform classical assumption tests and hypothesis testing using multiple linear regression analysis.
- 😀 The classical assumption tests include normality, heteroscedasticity, and multicollinearity, which are essential for using parametric analysis.
- 😀 To check for normality, the residuals are analyzed through a one-sample Kolmogorov-Smirnov test, with a p-value greater than 0.05 indicating a normal distribution.
- 😀 Heteroscedasticity is tested by calculating absolute residuals and performing a linear regression analysis on these residuals. A p-value greater than 0.05 indicates no heteroscedasticity.
- 😀 Multicollinearity is tested using tolerance and VIF values. Tolerance greater than or equal to 0.10 and VIF less than 10 indicate no multicollinearity.
- 😀 Once all classical assumptions are satisfied, hypothesis testing begins with partial tests (t-test), simultaneous tests (F-test), and the coefficient of determination (R^2).
- 😀 The t-test checks whether each independent variable significantly influences the dependent variable. A p-value less than 0.05 indicates a significant effect.
- 😀 The F-test (simultaneous test) assesses whether all independent variables together significantly influence the dependent variable. A p-value less than 0.05 indicates a significant overall effect.
- 😀 The coefficient of determination (R^2) measures how much of the variation in the dependent variable is explained by the independent variables. An R^2 of 42.8% means that the independent variables explain 42.8% of the variance in the dependent variable.
- 😀 The video concludes by emphasizing that all classical assumptions must be met before performing multiple regression analysis and offers an understanding of hypothesis testing in regression models.
Q & A
What are the key assumptions tested in this video related to multiple linear regression?
-The key assumptions tested in the video are normality, heteroscedasticity, and multicollinearity.
What is the purpose of testing normality in multiple linear regression analysis?
-Testing normality ensures that the residuals (errors) of the regression model are normally distributed, which is a critical assumption for valid statistical inference in regression analysis.
How is normality tested in the script, and what is the decision rule?
-Normality is tested using the Kolmogorov-Smirnov (KS) test. The decision rule is if the p-value (asymptotic significance) is greater than or equal to 0.05, the data is considered normally distributed.
What does a p-value greater than 0.05 indicate in normality testing?
-A p-value greater than 0.05 indicates that the data follows a normal distribution.
What does heteroscedasticity refer to, and why is it important in regression analysis?
-Heteroscedasticity refers to the condition where the variance of residuals is not constant across all levels of the independent variables. It is important because it violates the assumption of constant variance, potentially leading to biased statistical inferences.
How is heteroscedasticity tested in this analysis?
-Heteroscedasticity is tested by analyzing the absolute residuals and performing a regression to check if the p-value for the independent variables is greater than 0.05, indicating no heteroscedasticity.
What does the tolerance and VIF test in multicollinearity indicate?
-Tolerance and the Variance Inflation Factor (VIF) test for multicollinearity by measuring how much the variance of an estimated regression coefficient increases when independent variables are correlated. Tolerance values less than 0.10 or VIF values greater than 10 indicate the presence of multicollinearity.
How is multicollinearity assessed in this script, and what are the criteria for no multicollinearity?
-Multicollinearity is assessed by looking at the tolerance values and VIF values. If tolerance is greater than or equal to 0.10 and VIF is less than or equal to 10 for all independent variables, it indicates no multicollinearity.
What is the significance of the Adjusted R-squared value in the multiple regression analysis?
-The Adjusted R-squared value represents the proportion of variance in the dependent variable that is explained by the independent variables. In this case, 42.8% of the variance in the dependent variable is explained by the six independent variables.
How are hypothesis tests conducted in this analysis, and what are the different types of tests used?
-Hypothesis tests are conducted using the t-test for partial tests, the F-test for simultaneous tests, and the coefficient of determination (R-squared) for overall model fit. The t-test evaluates the individual effect of each independent variable, while the F-test evaluates the joint effect of all independent variables.
Outlines

This section is available to paid users only. Please upgrade to access this part.
Upgrade NowMindmap

This section is available to paid users only. Please upgrade to access this part.
Upgrade NowKeywords

This section is available to paid users only. Please upgrade to access this part.
Upgrade NowHighlights

This section is available to paid users only. Please upgrade to access this part.
Upgrade NowTranscripts

This section is available to paid users only. Please upgrade to access this part.
Upgrade NowBrowse More Related Video
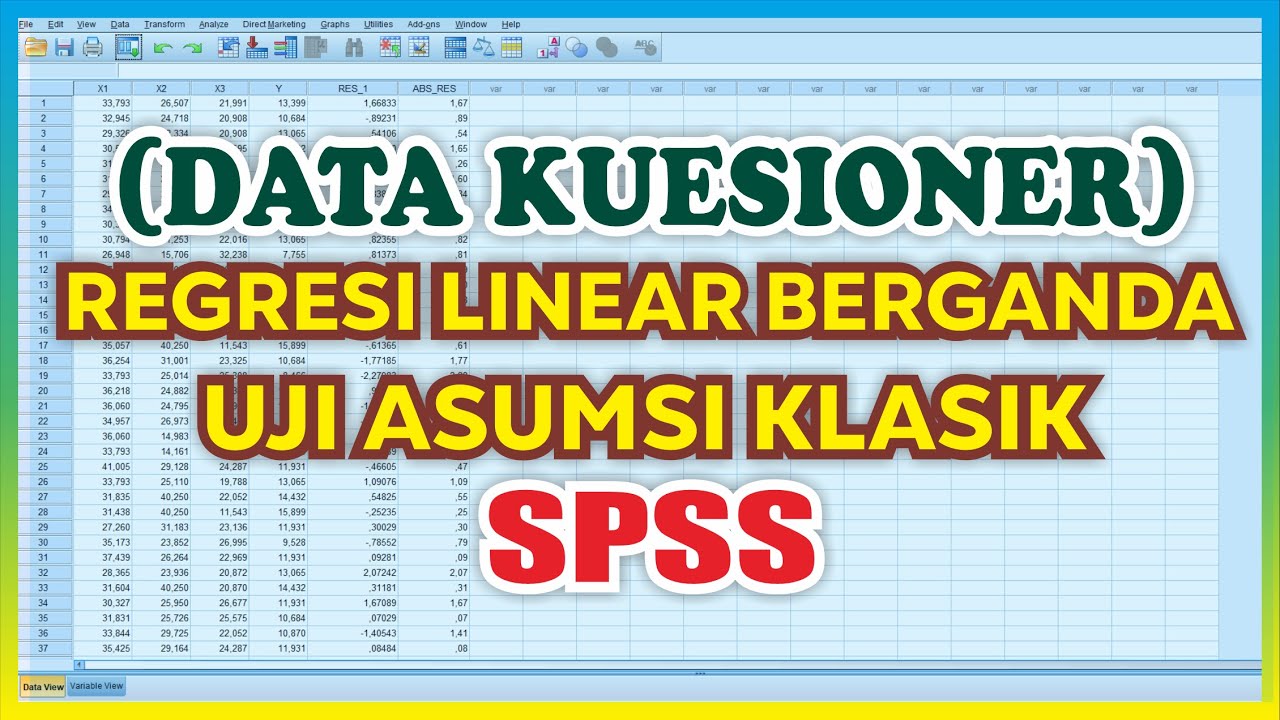
Uji Asumsi Klasik SPSS Data Kuesioner beserta Analisis Regresi Linear Berganda
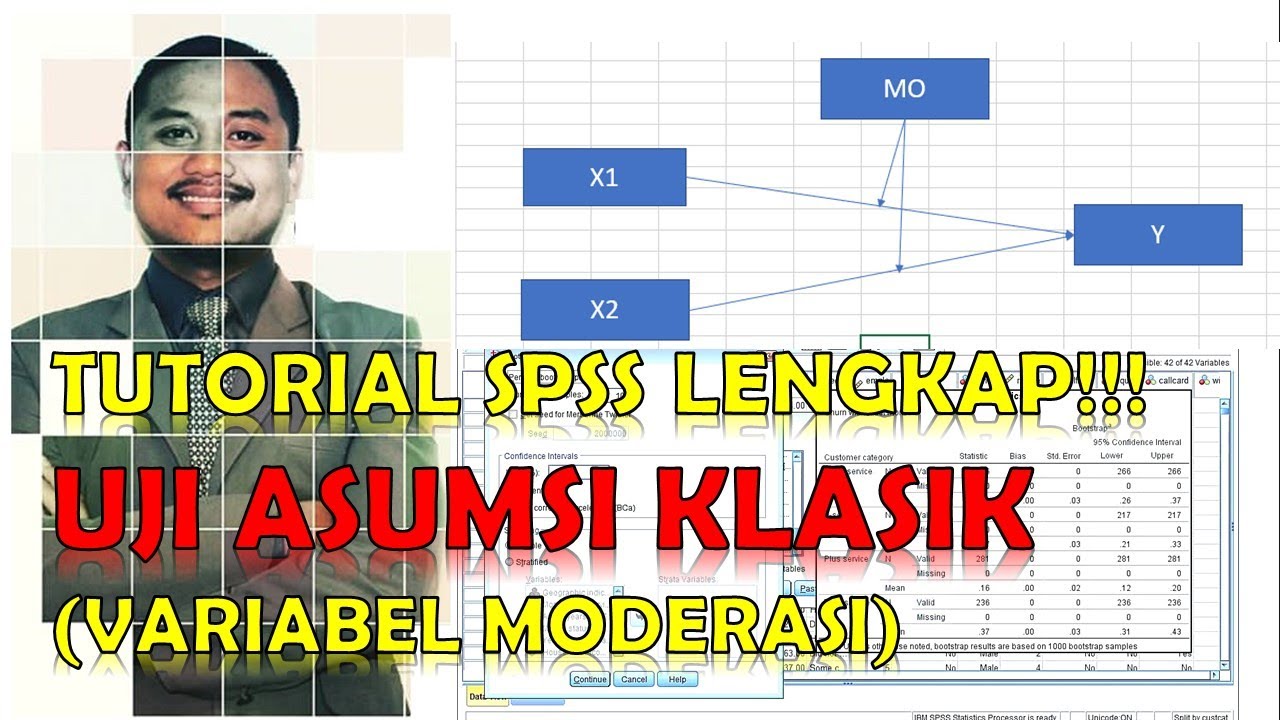
TUTORIAL UJI ASUMSI KLASIK VARIABEL MODERASI DENGAN SPSS -TERBARU ❗❗❗

Tutorial Uji Asumsi Klasik dengan SPSS serta Interpretasi Output

KULIAH STATISTIK - ANALISIS REGRESI

SPSS : Uji t, Uji F dan Koefisien Determinasi dalam Analisis Regresi Berganda
Statistika: Uji Korelasi-Regresi sederhana menggunakan SPSS
5.0 / 5 (0 votes)