Uji Regresi Linier Sederhana Dengan SPSS | Pembahasan Lengkap!
Summary
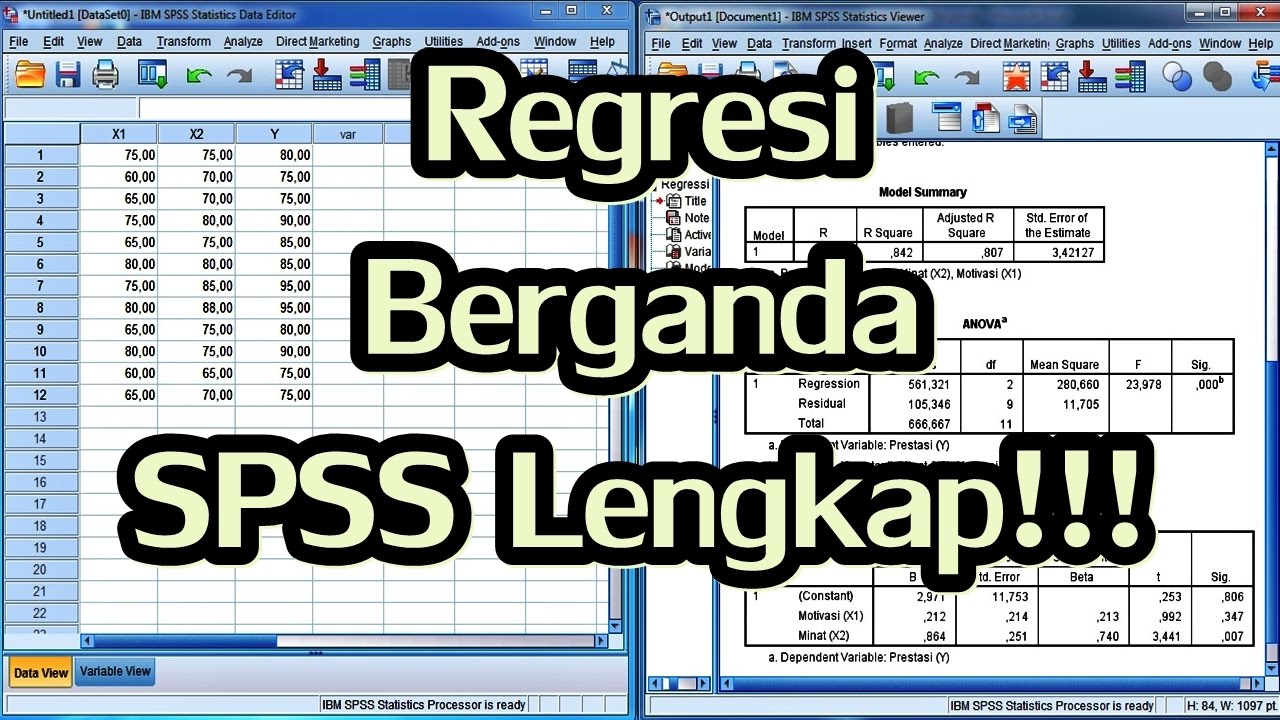
TLDRIn this tutorial, Endah demonstrates how to perform simple linear regression analysis using SPSS. The goal is to understand the influence of promotional efforts (X) on sales (Y). The video covers essential steps, including data input, hypothesis testing, and interpreting SPSS output. Endah explains how to calculate the regression equation, interpret significance values, and assess the impact of promotion on sales. The session also covers the determination of the coefficient of determination (R-squared), showing how promotion affects 58.1% of sales. Overall, the video provides a clear, step-by-step guide for conducting regression analysis with SPSS.
Takeaways
- 😀 The purpose of conducting a simple linear regression test is to determine if there is an effect of variable X on variable Y.
- 😀 Before performing the linear regression test, it is essential to conduct normality and linearity tests.
- 😀 The regression equation for a simple linear regression is represented as y = a + BX + C.
- 😀 The decision-making process involves two approaches: using the significance value and comparing t-hitung (calculated t) with the t-table value.
- 😀 The variables in this case are promotion (X) and sales (Y), and the hypothesis suggests that there is a positive and significant effect of promotion on sales.
- 😀 After entering the research data into SPSS, rename the variables and ensure the correct decimal places and measurement levels.
- 😀 To conduct a simple linear regression test in SPSS, go to 'Analyze', select 'Regression', and then 'Linear'.
- 😀 In the output, pay attention to the coefficients table to formulate the regression equation, which represents the relationship between promotion and sales.
- 😀 To test the hypothesis, examine the significance value and compare t-hitung with t-table to determine if the relationship is significant.
- 😀 The R-squared value indicates how much the independent variable (promotion) affects the dependent variable (sales). In this case, promotion explains 58.1% of sales variation.
- 😀 The remaining 41.9% of sales variation is influenced by other factors not explored in this study.
Q & A
What is the purpose of conducting a simple linear regression test?
-The purpose of conducting a simple linear regression test is to determine whether there is a significant influence of the independent variable (X) on the dependent variable (Y). It helps in understanding the relationship between the two variables.
What are the prerequisites before performing a simple linear regression test?
-Before performing a simple linear regression test, it is necessary to first conduct normality and linearity tests to ensure the data meets the assumptions required for regression analysis.
What is the general formula for a simple linear regression model?
-The general formula for a simple linear regression model is: Y = A + BX + C, where Y is the dependent variable, A is the constant, B is the coefficient for the independent variable (X), and C is the error term.
How do you interpret the regression equation in terms of the variables used?
-In the regression equation Y = 38.575 + 0.569X, the constant value of 38.575 indicates that when the promotion (X) is zero, the sales (Y) will be 38.575. The coefficient of 0.569 suggests that for every one-unit increase in promotion, sales will increase by 0.569 units.
What are the two methods for making decisions in hypothesis testing in regression analysis?
-The two methods for making decisions in hypothesis testing are: 1) using the significance value (p-value) and comparing it to the established alpha level of 0.05, and 2) comparing the calculated t-value (t-hit) to the critical t-value (t-table).
What does the significance value indicate in hypothesis testing?
-The significance value indicates whether the independent variable (promotion) has a statistically significant effect on the dependent variable (sales). If the p-value is less than the significance level (0.05), it suggests a significant influence.
How is the critical t-value (t-table) calculated in regression analysis?
-The critical t-value is calculated using the formula: t-table = n - k, where n is the number of samples, and k is the number of variables used in the regression model. The result is then compared with the calculated t-hit value.
How can we determine the strength of the relationship between the variables in regression analysis?
-The strength of the relationship is determined by the R-squared value (coefficient of determination). This value shows the percentage of variance in the dependent variable (sales) that is explained by the independent variable (promotion).
What does an R-squared value of 0.581 mean in this regression analysis?
-An R-squared value of 0.581 means that 58.1% of the variance in sales is explained by the promotion variable, while the remaining 41.9% is influenced by other factors not included in the model.
Why is it important to visualize the coefficient of determination using a Venn diagram?
-Visualizing the coefficient of determination using a Venn diagram helps to clearly show how much of the variance in the dependent variable (sales) is explained by the independent variable (promotion), and how much is due to other unmeasured factors.
Outlines

This section is available to paid users only. Please upgrade to access this part.
Upgrade NowMindmap

This section is available to paid users only. Please upgrade to access this part.
Upgrade NowKeywords

This section is available to paid users only. Please upgrade to access this part.
Upgrade NowHighlights

This section is available to paid users only. Please upgrade to access this part.
Upgrade NowTranscripts

This section is available to paid users only. Please upgrade to access this part.
Upgrade NowBrowse More Related Video


5.0 / 5 (0 votes)