Contoh Soal dan Pembahasan Korelasi Pearson | Matematika Wajib SMA Kelas XI Kurikulum Merdeka
Summary
TLDRIn this educational video, the speaker explains how to calculate the Pearson correlation coefficient and coefficient of determination for the relationship between run-up distance and jump distance in long jump athletes. The video provides step-by-step guidance on determining the variables, calculating necessary sums, and applying the Pearson formula to find a strong correlation (0.944). The tutorial also highlights that 89.11% of the variation in jump distance is explained by the run-up distance, with the remaining 10% attributed to other factors like training and rest. Viewers are encouraged to use calculators to simplify the computations.
Takeaways
- 😀 Understanding the Pearson correlation is crucial for determining the strength of the relationship between two variables.
- 😀 The first step in solving correlation problems is to identify the independent variable (X) and the dependent variable (Y).
- 😀 In the example, the independent variable is the 'runoff distance' (X), and the dependent variable is the 'jump distance' (Y).
- 😀 Correctly identifying the variables prevents errors in calculations and ensures the accuracy of results.
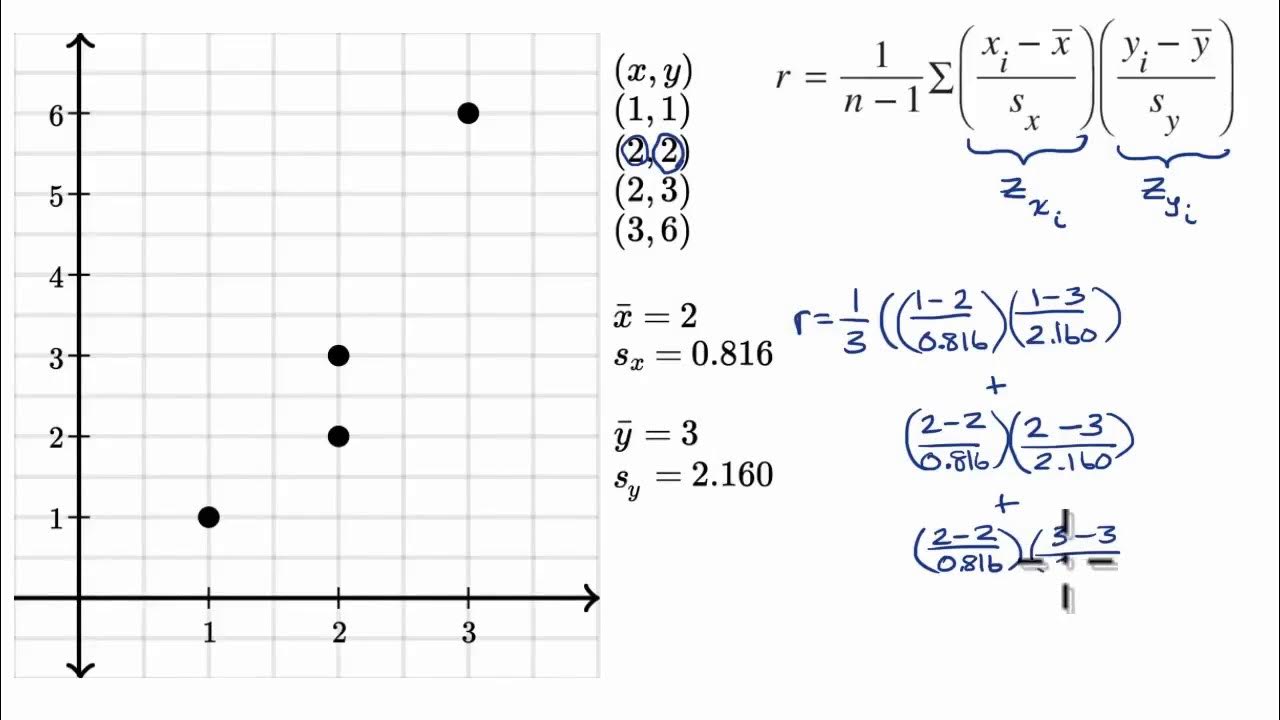
- 😀 The Pearson correlation coefficient (r) is calculated using a specific formula that includes summing values and squaring them.
- 😀 The correlation coefficient (r) is a measure of the strength and direction of the linear relationship between two variables.
- 😀 A correlation coefficient value of 0.944 suggests a very strong positive correlation between the runoff distance and jump distance.
- 😀 The coefficient of determination (R²) is calculated by squaring the Pearson correlation coefficient and expresses the proportion of variance explained by the relationship.
- 😀 An R² value of 0.889 (or 89.11%) indicates that the runoff distance explains 89.11% of the variation in jump distance.
- 😀 The remaining 10.89% of the variation in jump distance is attributed to other factors, such as training, nutrition, or rest.
- 😀 The video emphasizes the importance of using appropriate tools like calculators for large data sets to simplify complex calculations.
Q & A
What is the main topic discussed in the video?
-The main topic discussed is the correlation analysis between two variables, specifically the relationship between the distance of the 'run-up' and the jump achievement in long jump events.
What method is used to determine the correlation between two variables?
-The method used is Pearson's correlation, which measures the strength and direction of the relationship between two variables.
What are the key steps involved in calculating Pearson's correlation coefficient?
-The steps involve determining the independent (X) and dependent (Y) variables, calculating sums like Sigma X, Sigma Y, Sigma X*Y, and Sigma X^2, and then applying the Pearson correlation formula to obtain the coefficient (r).
How do you determine the independent and dependent variables in this example?
-The independent variable (X) is the 'run-up' distance, as it influences the dependent variable (Y), which is the jump achievement. The run-up distance is considered the factor that affects the jump performance.
What is the purpose of calculating the correlation coefficient (r)?
-The purpose of calculating the correlation coefficient is to determine how strongly the two variables are related. A high positive value of r indicates a strong positive correlation.
What does the coefficient of determination represent, and how is it calculated?
-The coefficient of determination (R^2) represents the percentage of variation in the dependent variable that can be explained by the independent variable. It is calculated by squaring the Pearson correlation coefficient (r) and multiplying by 100.
What was the calculated Pearson correlation coefficient (r) in this example?
-The calculated Pearson correlation coefficient (r) in this example was 0.944, which indicates a very strong positive correlation between the run-up distance and jump achievement.
How is the coefficient of determination (R^2) calculated from the correlation coefficient (r)?
-The coefficient of determination is calculated by squaring the Pearson correlation coefficient (r) and multiplying the result by 100 to express it as a percentage. In this case, 0.944^2 = 0.8911, or 89.11%.
What does an R^2 value of 89.11% mean in this context?
-An R^2 value of 89.11% means that 89.11% of the variation in jump achievement can be explained by the run-up distance, indicating a strong influence of the independent variable on the dependent variable.
What other factors could influence the jump achievement besides the run-up distance?
-Other factors that could influence jump achievement include training, rest, diet, and overall physical condition, which contribute to the remaining 10.89% of the variation in the jump performance.
Outlines

Cette section est réservée aux utilisateurs payants. Améliorez votre compte pour accéder à cette section.
Améliorer maintenantMindmap

Cette section est réservée aux utilisateurs payants. Améliorez votre compte pour accéder à cette section.
Améliorer maintenantKeywords

Cette section est réservée aux utilisateurs payants. Améliorez votre compte pour accéder à cette section.
Améliorer maintenantHighlights

Cette section est réservée aux utilisateurs payants. Améliorez votre compte pour accéder à cette section.
Améliorer maintenantTranscripts

Cette section est réservée aux utilisateurs payants. Améliorez votre compte pour accéder à cette section.
Améliorer maintenantVoir Plus de Vidéos Connexes

LATIHAN 3 (KORELASI PEARSON) BAB 2 REGRESI DAN KORELASI (Matematika 11B)

Korelasi Spearman - Matematika Wajib SMA Kelas XI Kurikulum Merdeka

Pearson correlation [Simply explained]

How To Perform A Pearson Correlation Test In Excel

excel and correlation

Cálculo del coeficiente de correlación r | Khan Academy en Español
5.0 / 5 (0 votes)
