Korelasi Spearman - Matematika Wajib SMA Kelas XI Kurikulum Merdeka
Summary
TLDRIn this video, the presenter explains the concept of Spearman's correlation analysis as part of a series on correlation methods for 11th-grade mathematics, following the Merdeka curriculum. The video contrasts Spearman's method with Pearson's correlation, emphasizing its use for ordinal data or data that can be ranked. The presenter walks viewers through the steps to calculate Spearman's correlation coefficient using a sample problem, involving the relationship between students' heights and their long jump distances. The video concludes by explaining how to interpret the correlation coefficient and the impact of height on jump performance, showcasing the practical application of Spearman's analysis in real-world data.
Takeaways
- 😀 The video discusses the correlation analysis methods used in mathematics for the 11th-grade curriculum under Merdeka, focusing on Spearman's correlation.
- 😀 The first method covered was Pearson's correlation, and the second method is Spearman's correlation, which is used when dealing with ordinal data or rankings.
- 😀 Spearman's correlation is used when analyzing relationships between two variables that can be ranked, such as in ordinal data, unlike Pearson's correlation which typically applies to interval or ratio data.
- 😀 The formula for calculating Spearman's correlation coefficient (rs) is: 1 - 6 * Σd^2 / (n * (n^2 - 1)), where d is the difference between the ranks of corresponding variables, and n is the number of pairs of data.
- 😀 It is important to rank the values of both variables (X and Y) before calculating Spearman's correlation, ensuring that tied values are averaged.
- 😀 In case of tied ranks, the average rank is used to resolve the tie, ensuring fairness in the calculation.
- 😀 The process involves ranking both variables, calculating the squared differences between ranks, summing these squared differences, and then applying the formula to get the correlation coefficient.
- 😀 The coefficient of determination (r^2) can be used to determine the strength of the relationship between the two variables, with r^2 representing the proportion of variance explained by the independent variable.
- 😀 An example problem illustrates how Spearman's correlation is applied to determine the relationship between students' heights and their long jump performances.
- 😀 The final result for Spearman's correlation coefficient in the example problem was 0.5, indicating a moderate positive correlation between height and jump performance. The coefficient of determination was 25%, meaning that height explains 25% of the variation in jump performance.
Q & A
What is the main topic of the video?
-The main topic of the video is about correlation analysis, specifically focusing on Spearman's correlation method, which is part of the mathematics curriculum for 11th grade under the Merdeka Curriculum.
How does Spearman's correlation differ from Pearson's correlation?
-Spearman's correlation is used when analyzing ordinal variables, where the values can be ranked. In contrast, Pearson's correlation is typically used for interval or ratio-scaled data.
What is an ordinal variable?
-An ordinal variable is one that has categories that can be ordered or ranked based on their level or degree, such as rankings in competitions or survey responses on a scale of 1 to 5.
How do you calculate the Spearman correlation coefficient?
-To calculate the Spearman correlation coefficient, first rank the values of both variables. Then, compute the differences between the ranks (D), square them (D^2), sum them up (ΣD^2), and use the formula: 1 - (6 * ΣD^2) / (n * (n^2 - 1)).
What does the 'D' in the formula for Spearman's correlation represent?
-In the formula for Spearman's correlation, 'D' represents the difference between the ranks of the two variables for each pair of data points.
What is the significance of the coefficient of determination (r^2)?
-The coefficient of determination (r^2) indicates the proportion of variance in the dependent variable that can be explained by the independent variable. It is obtained by squaring the Spearman correlation coefficient and multiplying by 100 to express it as a percentage.
How is the rank of a tied score determined in Spearman's correlation?
-For tied scores (i.e., when two or more values are the same), the rank is determined by averaging the ranks that those tied values would have occupied. For example, if two values are tied for ranks 2 and 3, they both receive a rank of 2.5.
In the example provided in the video, what was the relationship between height and jump distance?
-The video analyzed the relationship between height and jump distance for six students. The Spearman correlation coefficient was calculated and found to be 0.5, indicating a moderate positive relationship between height and jump distance.
What is the meaning of a Spearman correlation coefficient of 0.5?
-A Spearman correlation coefficient of 0.5 indicates a moderate positive relationship between the two variables, meaning that as one variable increases, the other tends to increase as well, but not in a perfectly linear fashion.
How does the correlation coefficient help in understanding the relationship between two variables?
-The correlation coefficient quantifies the strength and direction of the relationship between two variables. A positive value suggests a direct relationship, while a negative value suggests an inverse relationship. The closer the coefficient is to 1 or -1, the stronger the relationship.
Outlines

This section is available to paid users only. Please upgrade to access this part.
Upgrade NowMindmap

This section is available to paid users only. Please upgrade to access this part.
Upgrade NowKeywords

This section is available to paid users only. Please upgrade to access this part.
Upgrade NowHighlights

This section is available to paid users only. Please upgrade to access this part.
Upgrade NowTranscripts

This section is available to paid users only. Please upgrade to access this part.
Upgrade NowBrowse More Related Video

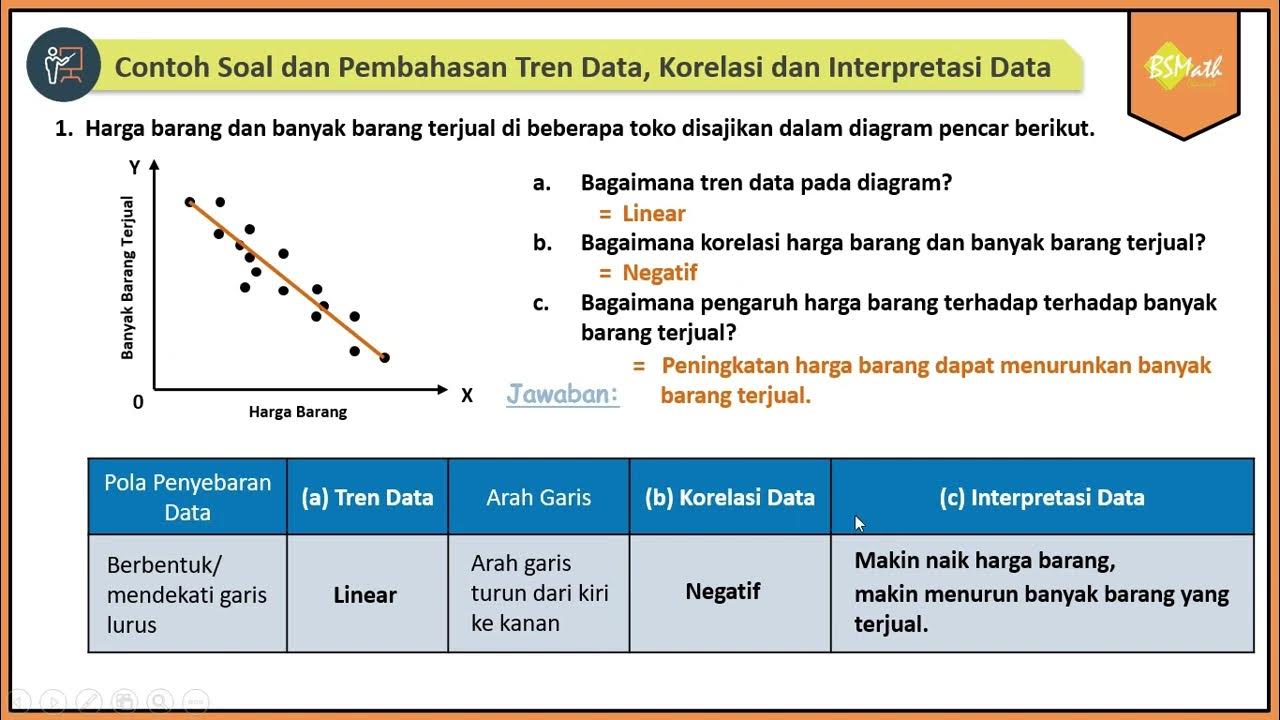
Contoh Soal dan Pembahasan Tren Data, Korelasi dan Interpretasi Data Bivariat Diagram Pencar

Tutorial atau Cara Uji Korelasi Spearman Hitung Manual dan SPSS

Spearmen's Rank Correlation || Gnani The Knowledge ||

Statistics Lecture 5 Test of Relationship

LATIHAN 3 (KORELASI PEARSON) BAB 2 REGRESI DAN KORELASI (Matematika 11B)

Spearman Rank Correlation [Simply explained]
5.0 / 5 (0 votes)