LATIHAN 3 (KORELASI PEARSON) BAB 2 REGRESI DAN KORELASI (Matematika 11B)
Summary
TLDRIn this educational video, the instructor walks through a detailed lesson on calculating the correlation coefficient in a mathematics exercise for 11th-grade students. The topic focuses on the relationship between the run-up distance and long jump performance. Using a dataset, the instructor demonstrates how to calculate the correlation coefficient, explain its meaning, and assess the strength of the relationship. Additionally, the video covers determining the coefficient of determination and the impact of run-up distance on jump performance. The session is a thorough, step-by-step guide to understanding and applying correlation analysis in real-life scenarios.
Takeaways
- 😀 The script focuses on teaching mathematics concepts, specifically correlation analysis, using an example of long jump distances and their relationship with the run-up distance.
- 😀 The task involves calculating the Pearson correlation coefficient (r) for a given data set, with run-up distance as the independent variable (X) and jump distance as the dependent variable (Y).
- 😀 The process begins with defining the variables, where the run-up distance is treated as the independent variable (X) and the jump distance as the dependent variable (Y).
- 😀 The formula for calculating the correlation coefficient involves summing various quantities, such as the product of X and Y, squares of X and Y, and their individual sums.
- 😀 The correlation coefficient (r) is calculated step by step, with the final result of 0.94 indicating a strong positive correlation between the two variables.
- 😀 A correlation of 0.94 means that as the run-up distance increases, the jump distance also increases, showing a direct relationship between them.
- 😀 The script explains that the coefficient of determination (r^2) can be found by squaring the correlation coefficient, yielding a value of 88.36%, meaning 88.36% of the variability in jump distance can be explained by the run-up distance.
- 😀 The script emphasizes that a correlation coefficient of 0.94 suggests a very strong positive relationship between run-up distance and jump distance.
- 😀 The calculation of the coefficient of determination helps to understand how much influence the independent variable (run-up distance) has on the dependent variable (jump distance).
- 😀 The script concludes by explaining the significance of the coefficient of determination: 88.36% of the variance in jump distance is explained by the run-up distance, while the remaining 11.64% is influenced by other factors.
Q & A
What is the first step in calculating the correlation coefficient for the given data?
-The first step is to determine the independent variable (X) and the dependent variable (Y). In this case, X represents the 'Run up' distance in meters, and Y represents the 'Jump achievement' in centimeters.
How do you calculate the correlation coefficient (r) for this data?
-To calculate the correlation coefficient (r), use the formula involving sums of X, Y, X², Y², and the product of X and Y. You substitute these values into the formula, which gives a value that indicates the strength and direction of the correlation.
What does the value of the correlation coefficient (r) represent in this context?
-The correlation coefficient (r) represents the strength and direction of the linear relationship between the independent variable (Run up distance) and the dependent variable (Jump achievement). A value of 0.94 indicates a strong positive correlation.
What is the significance of the result r = 0.94 in this analysis?
-An r value of 0.94 indicates a very strong positive correlation. This means that as the 'Run up' distance increases, the 'Jump achievement' also tends to increase, and vice versa.
What is the coefficient of determination, and how is it calculated?
-The coefficient of determination, r², is the square of the correlation coefficient. It quantifies the proportion of the variance in the dependent variable (Jump achievement) that can be explained by the independent variable (Run up distance). It is calculated by squaring the value of r (0.94² = 0.8836) and multiplying by 100% to express it as a percentage.
How is the coefficient of determination interpreted in this case?
-In this case, the coefficient of determination is 88.36%. This means that 88.36% of the variance in 'Jump achievement' can be explained by the 'Run up' distance, while the remaining 11.64% is influenced by other factors.
What does the positive correlation between 'Run up' and 'Jump achievement' imply?
-A positive correlation of 0.94 implies that as the 'Run up' distance increases, the 'Jump achievement' also tends to increase. This suggests that longer 'Run up' distances contribute to greater jump distances.
What does it mean if the correlation coefficient (r) is greater than 0?
-If the correlation coefficient (r) is greater than 0, it indicates a positive correlation. In this case, as one variable increases, the other also increases. A higher value of r (closer to 1) indicates a stronger positive relationship.
Why is the calculation of both X² and Y² important in the formula for correlation?
-The calculation of X² and Y² is important because it helps account for the variance of both the independent and dependent variables. These values are used to determine the degree to which each variable deviates from its mean, which is essential in calculating the correlation coefficient.
What is the role of the 'Run up' variable in this correlation analysis?
-The 'Run up' variable, which is the independent variable (X), plays a key role in predicting the 'Jump achievement' (Y). The analysis shows that the distance of the 'Run up' directly affects the distance of the jump, with a strong positive correlation observed between the two.
Outlines

This section is available to paid users only. Please upgrade to access this part.
Upgrade NowMindmap

This section is available to paid users only. Please upgrade to access this part.
Upgrade NowKeywords

This section is available to paid users only. Please upgrade to access this part.
Upgrade NowHighlights

This section is available to paid users only. Please upgrade to access this part.
Upgrade NowTranscripts

This section is available to paid users only. Please upgrade to access this part.
Upgrade NowBrowse More Related Video
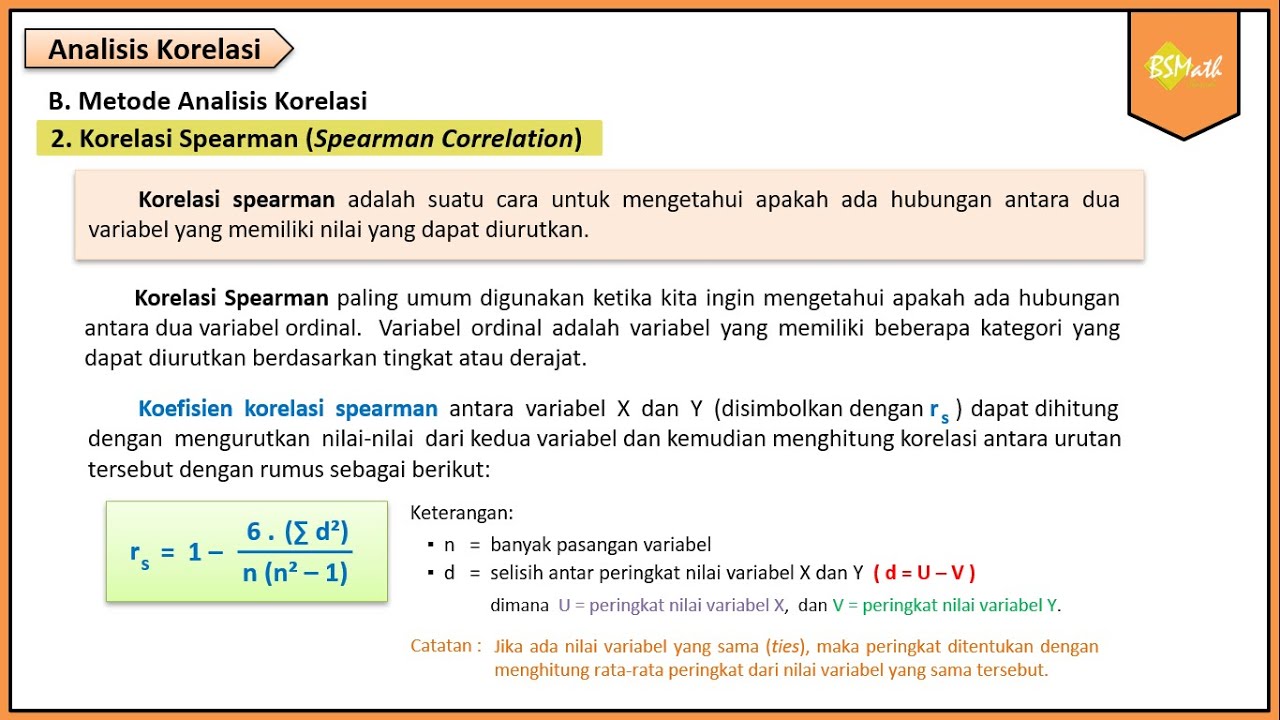
Korelasi Spearman - Matematika Wajib SMA Kelas XI Kurikulum Merdeka
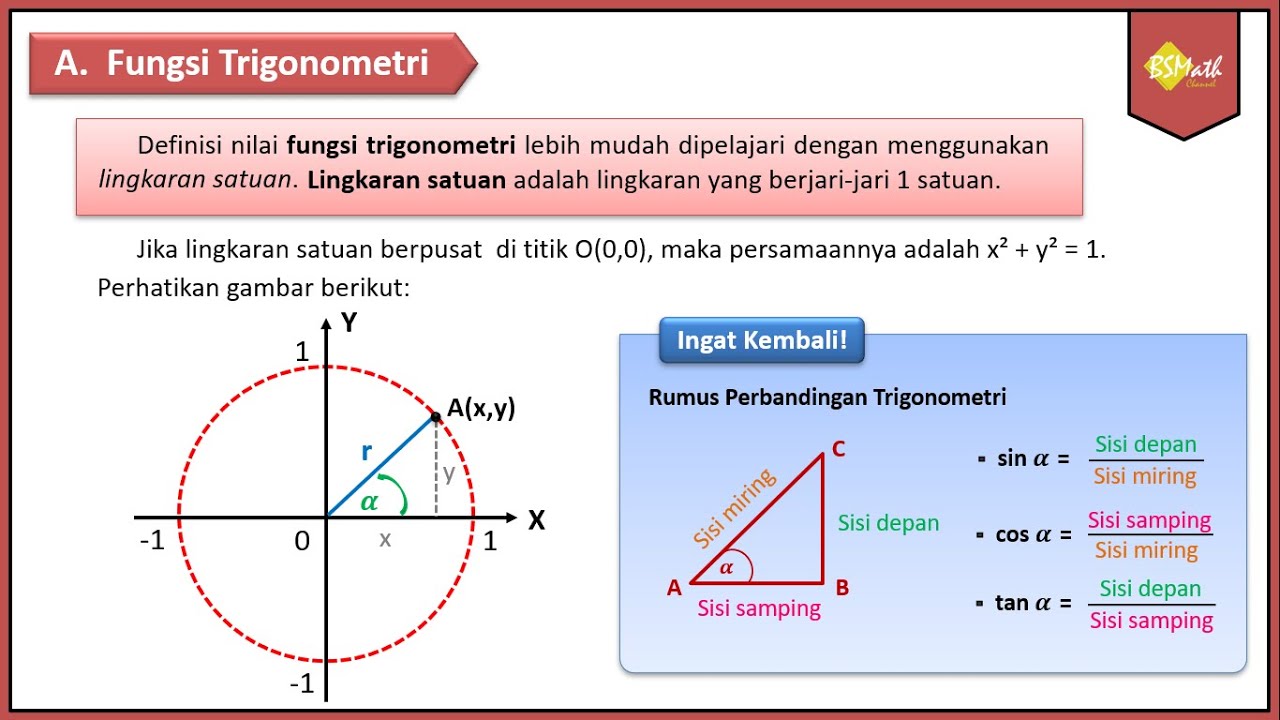
Tanda Fungsi Trigonometri Tiap Kuadran | Matematika Tingkat Lanjut SMA Kelas XI Kurikulum Merdeka

Latihan PAT Polinom/Suku Banyak ke (2) Matematika Peminatan XI MIPA Rosidawati Sinurat M.Pd

Kelarutan dan Hasil Kali Kelarutan (3) | Prakiraan Pengendapan | Menentukan Massa Endapan

Korelasi Product Moment (r) Hal 110-116 Bab 3 STATISTIK Kelas 11 SMA Kurikulum Merdeka

Ekonomi Kelas XI Bab 1: Pendapatan Nasional (Pertemuan 1)
5.0 / 5 (0 votes)