Statistics - Module 3 - Mean, Median, Mode, Percentiles and Quartiles - Problem 3-1B
Summary
TLDRThis educational video script delves into statistical measures of central tendency, focusing on mean, median, and mode. It explains the arithmetic mean, or average, by demonstrating its calculation with a simple dataset. The script contrasts the mean's sensitivity to extreme values with the median's resilience, which divides a dataset into two equal halves. It also introduces the mode as the most frequent value, noting the possibility of multiple modes leading to a multimodal distribution. The presenter emphasizes the importance of understanding these basic concepts and their formal notation, as they form the foundation for more complex statistical analyses.
Takeaways
- 📊 The video discusses three measures of central tendency: mean, median, and mode.
- 🔢 The arithmetic mean (average) is calculated by summing all data points and dividing by the number of points.
- 📈 The mean is influenced by the magnitude of data points, unlike the median.
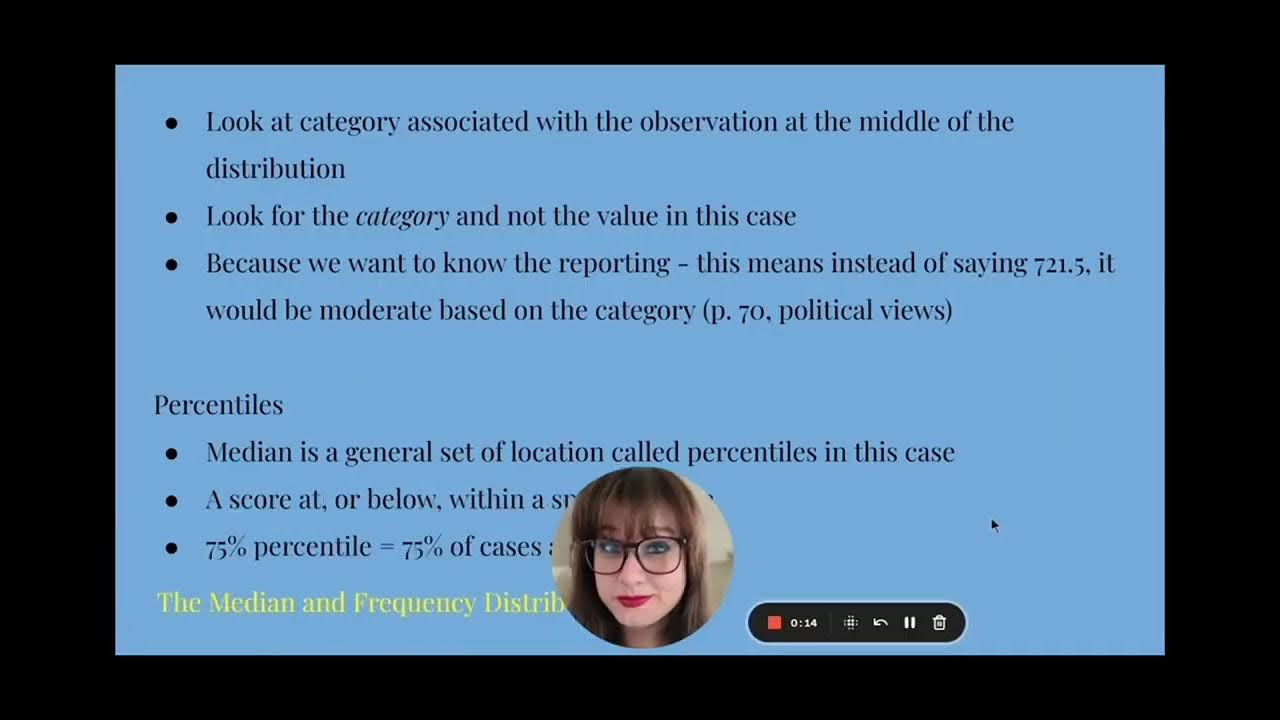
- 🎯 The median is the middle value in a data set, where 50% of observations are greater and 50% are lesser.
- 🔠 The mode is the value that occurs most frequently in a data set; a set can be unimodal, bimodal, or multimodal.
- ✅ The video demonstrates how to calculate mean, median, and mode using a sample of 30 company share prices.
- 📚 The script emphasizes the importance of understanding the notation and formulas for calculating mean, as they will be foundational for more complex concepts.
- 💡 The video provides a detailed walkthrough of calculating the mean, including the formula and its notation.
- 📋 The median is calculated by sorting the data and finding the middle value(s), which is crucial for even-numbered data sets.
- 🔍 The mode is identified by observing the frequency of each value in the sorted data set.
- 📝 The video concludes by reinforcing the importance of comfort with basic statistical calculations and notation for future learning.
Q & A
What are the three measures of central location discussed in the video?
-The three measures of central location discussed in the video are mean, median, and mode.
What is the formula for calculating the arithmetic mean?
-The formula for calculating the arithmetic mean is the sum of all data points divided by the number of data points.
How does the arithmetic mean differ from the median in terms of how it is influenced by the data points?
-The arithmetic mean is influenced by the magnitude of the data points, while the median is not affected by the size of the values but rather their order.
What is the median and how is it found in a dataset?
-The median is the value that separates the higher half from the lower half of a data sample. It is found by arranging the data points in order and picking the middle value or the average of the two middle values if there is an even number of observations.
What is the mode and how is it determined?
-The mode is the value that occurs most frequently in a data set. It is determined by identifying the observation(s) that repeat the most.
Can a dataset have more than one mode? If so, what is it called?
-Yes, a dataset can have more than one mode. If it has two modes, it is called bimodal, and if it has more than two, it is called multimodal.
What is the difference between the mean of a population and the mean of a sample?
-The mean of a population is calculated using the entire dataset, while the mean of a sample is calculated using a subset of the population.
What is the notation used for the mean of a sample?
-The notation used for the mean of a sample is x-bar (x̄).
How is the mean calculated when the number of observations is even?
-When the number of observations is even, the mean is calculated by taking the average of the two middle values after the data has been sorted.
What is the importance of understanding the notation and formula for calculating the mean?
-Understanding the notation and formula for calculating the mean is important because it provides a foundation for more complex statistical concepts and calculations that will be encountered in more advanced material.
Outlines
📊 Introduction to Measures of Central Tendency
The speaker begins by introducing the topic of the video, which is to explore various measures of location, specifically mean, median, and mode. The discussion starts with the mean, often referred to as the average. The arithmetic mean is explained as the sum of data points divided by the number of data points. An example is given using the data points 5, 5, 7, 10, and 14, which when summed and divided by 5, results in an arithmetic mean of 8.2. The speaker highlights that the mean is influenced by the magnitude of the data points, as changing one data point to 146 significantly alters the mean. This is contrasted with the median, which is the middle value when the data points are ordered, and is not affected by the magnitude of the data points. The mode, which is the value that occurs most frequently, is also introduced, and the concept of bimodal and multimodal data sets is briefly mentioned.
🔢 Formal Notation for Calculating the Mean
The speaker transitions to a more formal discussion of the arithmetic mean, emphasizing the importance of understanding the notation and formula used in calculations. Using the same data set from the previous example, the speaker assigns identifiers to each data point (x1, x2, x3, x4, x5) and explains that the mean is calculated by summing all observations (x1 through xn) and dividing by the number of observations (n). The generic formula for the mean is introduced, using the summation symbol to represent the sum of all xi values from 1 to n. The concept of a sample mean (x bar) is also explained, noting that it represents a subset of a larger population, using the Dow Jones Industrial Average as an example.
📈 Determining the Mode and Median of Share Prices
The speaker proceeds to an exercise involving the calculation of the mean, median, and mode of share prices for a list of 30 companies. The data is sorted from smallest to largest, which is beneficial for identifying both the median and mode. The mode is determined by identifying the observations that repeat, with the speaker noting that the highest frequency of repetition in the data set is twice, leading to multiple modes (30, 51, 100, and 132). To find the median, the speaker eliminates observations from both ends until reaching the middle of the data set, which in this case is a pair of observations (80 and 77). The median is then calculated as the average of these two values, resulting in 78.5.
💹 Calculating the Mean Share Price
Finally, the speaker calculates the mean share price for the 30 companies. The formula for the mean is reiterated, and the speaker demonstrates the calculation by summing all the share prices and dividing by the number of companies (30). The sum of the share prices is found to be 2558, and when divided by 30, the mean share price is calculated to be 85.26. The speaker concludes by emphasizing the importance of understanding the notation and formulas for calculating mean, median, and mode, as these concepts will become more complex in subsequent videos.
Mindmap
Keywords
💡Arithmetic Mean
💡Median
💡Mode
💡Central Tendency
💡Data Points
💡Observations
💡Sample Mean
💡Notation
💡Dow Jones Industrial Average
💡Multimodal
Highlights
Introduction to measures of location: mean, median, and mode.
Definition and calculation of the arithmetic mean.
Explanation of how the mean is influenced by extreme values.
Introduction to the median as a measure of central tendency.
Demonstration of how the median is unaffected by the magnitude of data points.
Discussion on the mode as a measure of the most frequent observation.
Explanation of multimodal datasets and how to identify them.
Formal notation and formula for calculating the arithmetic mean.
Differentiation between calculating the population mean and sample mean.
Practical exercise on calculating the mean, median, and mode of share prices.
Sorting data to facilitate the identification of median and mode.
Identification of multiple modes in the dataset.
Manual calculation of the median for an even number of observations.
Calculation of the mean using the formula and practical data.
Final results of the mean, median, and modes for the sample of companies.
Emphasis on the importance of understanding basic statistical notation for future complex concepts.
Conclusion and summary of the video's educational content.
Transcripts
hello welcome back uh this in this video
we're going to look at various measures
of location specifically here we're
going to look at mean median and mode
now if
i begin with the discussion on mean
this is one that you've probably heard
of you've probably calculated it before
it usually goes by the name average
uh more specifically uh the type of mean
that we're going to look at here and the
one that you're probably most aware of
is called an arithmetic
mean
and
this is a mean that is had by adding
adding your data points together
and dividing by the number of of data
points that you have so for example if
you have
5
5 7 10
14
if those are your different data points
that you're working with
then in order to calculate the mean
i'm just getting myself a calculator
then you add these together 5 plus 5
plus 7 plus 10
plus 14.
so that equals 41.
so here i have my mean is 41 divided by
well how many observations do i have one
two three four five observations divide
that by five and here we get what is
called our arithmetic mean which is 8.2
so this value of 8.2
is one measure of what we call central
tendency or central location it's a
measure of roughly the middle in this
case 8.2 is somewhere around here
it's roughly the middle of that data set
now one of the characteristics about
this mean this arithmetic mean
is that it is influenced by the the
value of those numbers
if this wasn't a 14 if this was instead
146
well you can imagine this numerator is
going to be much larger
we still have five observations so this
ratio is going to end up being a lot
larger meaning our measure of mean is
going to be somewhere way out here
so having different values within your
data set influences where that mean
where that arithmetic mean
will will fall
this is opposed to
the median
the other measure of of central tendency
or central location
uh but really the median doesn't pay a
lot of attention to the the magnitude of
those observations if i start off here
with my original data set
so if i get rid of that 6 and here we
just have 14.
what is my median well the median is at
value
where 50 of your observations are
greater than or equal to the median and
50 percent of your observations are less
than or equal to the median
so in this exercise where i have five
observations here my median is this
point right in the middle it's a seven
fifty percent of my observations are
greater than or equal to and fifty
percent are down here so it's really
splitting it right in half
that doesn't change if this is a 14 or
if this is 146. my median is still in
exactly the same location
so unlike the mean the median is not
influenced by the relative magnitude of
those values of those data points
the mode
is similar in the sense that it's not
impacted by the magnitude of any given
observation but the mode is is uh
identified by finding the observation
that occurs with the highest frequency
so in this case i have
two fives a seven a ten let's go back to
our fourteen
so i have here the the fives occur twice
each of the other values only occur once
so this is then my mode
so it's possible to have one mode if i
had another 14 i could have two modes
and we would call this
bimodal
if i had
another ten i have two fives two tens
two fourteens then we would call it
multimodal and so we can have as many
modes
really any number of modes
it's a relatively little value at this
point to to get into the discussion of
multimodal
data sets that may come up a little bit
later when we talk about probability
in some of the later modules of this
course now
i want to
come back before we do this exercise
specifically i want to come back to this
discussion on the mean
partly because as much as you're aware
of how to calculate it
you've probably done it before i want to
just briefly talk about uh the formal
notation uh of the formula that is used
and that you've probably used without
even knowing it uh for calculating a a
mean an arithmetic mean
so what we're going to do i'll work with
the same
data set of these five observations
and i'm just going to replace or give
each one sort of an identifier so i'll
call each of these values x1 x2 x3
and x4 and x5
so these different x's these can really
take on any value okay so our five
in in the first case our first
observation now this five i can denote
it this is x1 this is my first
observation
x4 this is my fourth observation in this
case it happens to be 10
out here x5 is in this case 14 this is
my fifth observation
my data set consists of a total of five
observations so i would say
n equals in this example
five
okay now
notice that n equals five so i have five
observations my last observation that
subscript that five is the exactly the
same as the number of observations that
i have okay maybe that's obvious i don't
know
so when we're calculating the mean
uh regardless of how many observations
we have
we're adding together x1 plus x2 plus x3
in this case i'll work with just these
five observations we're adding together
all of our observations and we're
dividing it by n
the number of observations that we have
this is probably obvious you've probably
been doing this
any time you've calculated a mean
now when we write
the formula the more generic formula for
a mean
what we'll use the notation is this
symbol here which means
the sum
of
so the sum of so adding all of these
different observations together the sum
of x
i
where i is just an index i is a
placeholder
and it takes on every value from 1
through to n
so this is just a shorthand way
of writing
what i've got right here in the
numerator
so it's the sum of x equals one
here's one x equals two
i equals three sorry two and three and
four and five all the way
to n
representing however many
observations we have in that data set
and then finally
once we take the sum and we've added all
of these observations together then we
divide by n and that's just the same as
what we've done here
so for our means this is the formula
that we're using that we've always used
you've probably used it before without
really looking at it in this format and
if we're calculating what we call a
sample mean
then this is denoted by x bar so what i
mean by a sample mean is it's a subset
of the population so in this example
i have a share of 30 companies
on the dow jones this is only 30
companies this isn't all of the
companies it's not the full population
of companies this is just a sample of
30. it's a subset of 30. so here the
notation for a sample
is x bar
okay so that's maybe a little bit more
detail than you want um at this point of
how to calculate a mean but the reason
why i want to discuss it is because
this is the really the simplest formula
that we're going to
encounter in this in the sequence of
videos uh and i i really want whoever
whoever is watching to understand this
notation and understand these formulas
because as we progress through the more
difficult material
these types of formulas are going to
evolve and they're going to grow and are
going to become increasingly complex so
it's very helpful if at this stage in
the game you have a good understanding
and a good degree of comfort uh working
with
this
kind of notation because it's going to
be following us for a while
okay so enough about this let's get into
our exercise here so we've got this uh
list of 30 companies we want to
calculate the mean median and mode
share price now i think i've given
myself a cheat here so i've already
listed the companies i've relisted the
companies in one column
from smallest value
to the largest value
now sorting
your data like this
is helpful for
at least two things one
it's really imperative to have it sorted
like this in order to identify the
median value so that value that lies
right in the middle of the data set so
it's
imperative for identifying the median
for identifying the mode it's also
helpful because having it sorted from
smallest to largest any values that
repeat themselves which is necessary for
identifying a mode they'll all be
grouped together and so it's much easier
to see repeating observations because
they're all grouped together so
let's let's start off with the mode
because
really that's probably the easiest one
to spot we're just looking for
observations
that repeat so as i go through i'm just
going to look through and say well
there's two thirties
there's two fifty ones
uh there's two one hundreds
there's two 132s
and i don't see any observation that
repeats more than twice if if we had an
observation that repeated three or four
or five times
then these pairs that i've identified
here are no longer relevant um
but because the highest frequency of the
observation is two
uh then it becomes relevant and i have
it looks like three of uh four
observations one two
three four observations
each repeating twice
none that repeat more than twice
so these values 30
51
100 and 132
those are all my modes
so there's one mode
to
so this data set
is what we would call multimodal
uh it has multiple modes it has multiple
observations that
repeat uh the same frequency
uh
more than any others okay
so there's our mode uh let's find our
median so when we've got a nice a bigger
data set like this there's different
ways that we can go about finding a
median
in another video we'll show you a way
using a simple formula
in this exercise let's just do it sort
of the manual way where we'll go through
and eliminate observations starting with
the smallest and the largest
and so if we just go through our data
set
and eliminate
my pens not lining up
and eliminate individual observations
small and large
until we converge
to something in the middle
this would be a lot easier if my pen
lined up properly on the screen
and so here we are is that is that right
with a median this is not right because
i have an even number of observations so
i can't have fallen
directly on to one observation if i have
an even number
of observations
then
i must narrow down and be left with a
pair of observations what i did right
there i went through this exercise and i
came to one observation well that can't
be the case because i know i have 30
observations here
so i need to finish at a pair of
observations so let me try this again
and hopefully
i'll converge
to a pair
otherwise i know i've got a larger
mistake that i'll need to deal with
there
so now we've gone through and i've
gotten down to here this pair of
observations 80
and 77. i don't want to erase those in
the same sense that i've erased or
deleted the others because then i'm left
with nothing and that's not really
helpful
in identifying
my my
medium so what i want to do now is find
the middle
of those two remaining observations so
in this case it's uh this is going to be
80 plus 77 divided by 2
and so let me get my calculator
80 plus 77
divided by 2 so that gives me 78.5
and so that's my median
so half of my observations are less than
78.5
and half of my observations are greater
than 78.5
okay so we've got our modes four modes
multimodal we have our median
now let's calculate our mean and so our
mean here this is going to be x bar
equals and our formula again
this is
looking tedious let me actually change
my color
so x bar equals so the sum
observations
x i is i equals 1 through n and n in
this case is 30 because i know i have 30
observations
divided by n
which is 30.
so i'm going to erase all of my blue
lines here so i can see my observations
better
okay
now i need my calculator
and let's uh just go through with this
calculation it might take a few seconds
you're welcome to fast forward a little
bit i'm just going to punch in each of
these numbers add them together and
divide by 30. so let's get started 27
plus 30
30
54 57 62
63 64 65
71
almost there 129
132
132
148
155
168.
so 2558 is the numerator
divided by
30
equals 85.26
so this is 85.26
is my mean so this is my average share
price of these 30 uh different companies
taken off of the dow jones industrial
average
okay so there we have our mean our
median and our four modes in this case
for the sample of 30 shares from the dow
jones industrial average i hope that has
helped i'm going on to 18 minutes it's a
little bit longer than i wanted
but i really think it's important to
have spent some time going over the
details and then the notation and the
formula for something that is
understandably a simple complex a simple
concept simple calculation
but as i said before the more
comfortable you are with this notation
at this point
the better off you'll be as the material
progresses and evolves into more
difficult
concepts okay thank you very much for
watching
Voir Plus de Vidéos Connexes
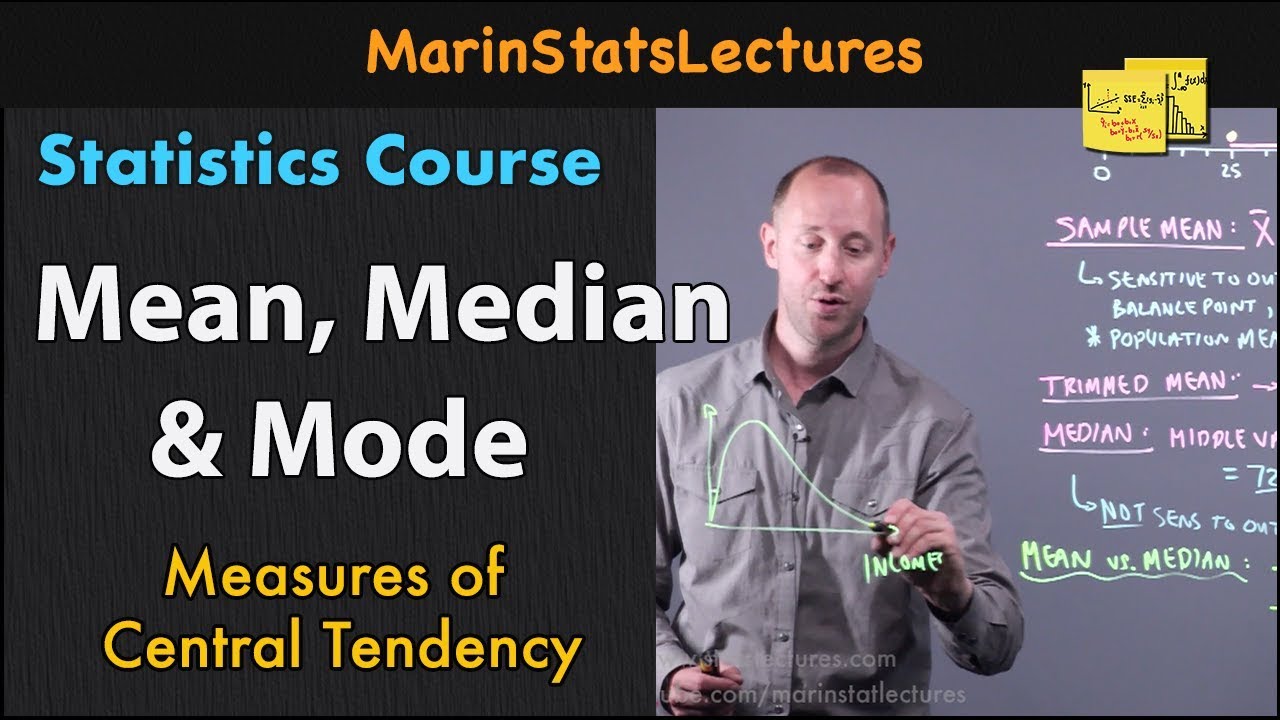
Mean, Median and Mode in Statistics | Statistics Tutorial | MarinStatsLectures
Ch 3 Lecture Video, Fall 2024: Measures of Central Tendency
Mode, Median, Mean, Range, and Standard Deviation (1.3)
MAT 152 SAS 8 Video
Statistics Grade 10: Mean, mode, median
Tutorial 4- Measure Of Central Tendency- Mean, Median And Mode In Hindi
5.0 / 5 (0 votes)