Ukuran pemusatan data, mean median modus, Statistika
Summary
TLDRThis educational video explains key statistical concepts, focusing on measures of central tendency (mean, median, and mode). It covers how to calculate the mean for both simple and grouped data, how to find the median in ordered datasets, and how to determine the mode as the most frequent value. The video provides clear examples and formulas, breaking down complex calculations into easily understandable steps, making it ideal for beginner students learning statistics. The content is delivered in an accessible and engaging manner, helping viewers grasp the fundamental principles of statistics.
Takeaways
- 😀 Understanding central tendency in statistics is crucial, and it involves measures like mean, median, and mode.
- 😀 The mean (average) is calculated by dividing the sum of all data points by the total number of data points.
- 😀 For grouped data, the mean can be calculated using the formula Σ(f * x) / Σf, where f is the frequency and x is the midpoint of each class.
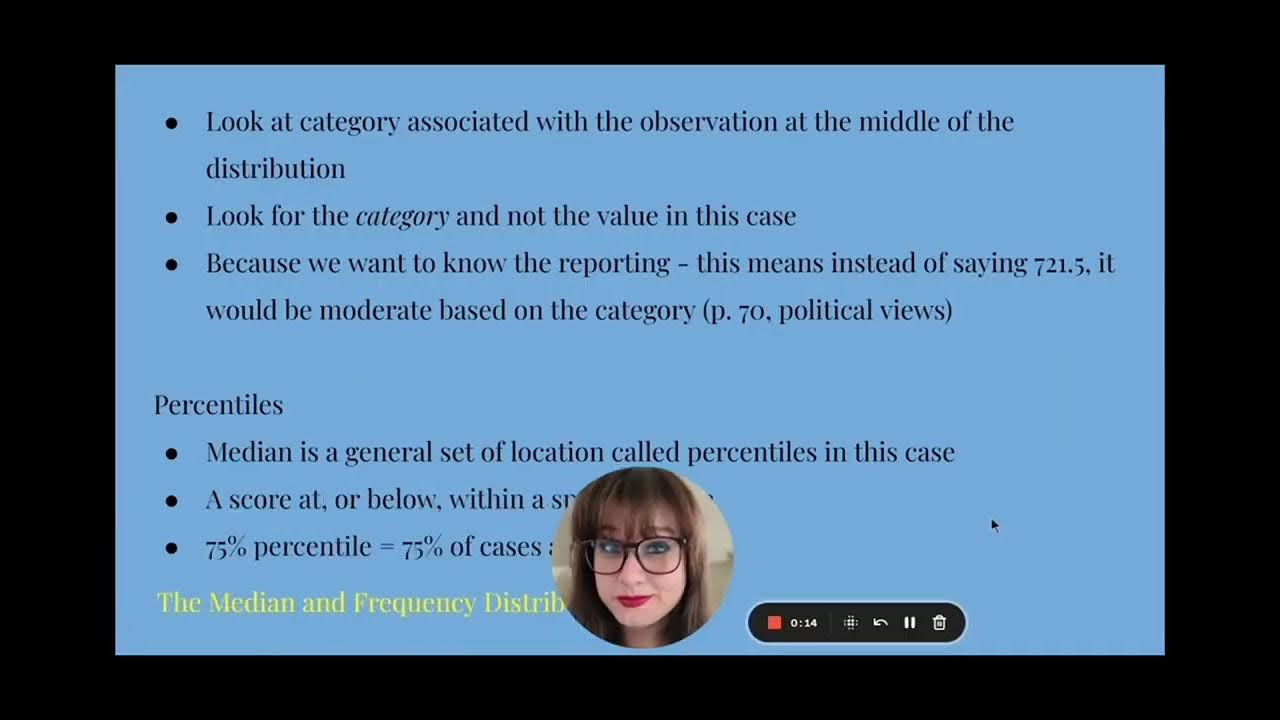
- 😀 Median is the middle value in a data set when it is ordered. For an odd number of data points, it is the middle value, and for an even number, it is the average of the two middle values.
- 😀 Mode is the most frequent value in a dataset and can be easily identified in simple datasets by locating the most repeated number.
- 😀 When dealing with grouped data, mode can be calculated using the formula: Lower class boundary of the modal class + (d1 / (d1 + d2)) * class width.
- 😀 For data with a single value (singular data), calculating the mean is straightforward by dividing the total by the number of observations.
- 😀 In the case of grouped data, determining the median involves identifying the cumulative frequency and using a formula to calculate the exact value of the median class.
- 😀 The script emphasizes the importance of knowing how to calculate these statistical measures for better data analysis and understanding.
- 😀 The video concludes with the promise of discussing other statistical measures like data spread and location in future tutorials.
Q & A
What are the key topics discussed in the video?
-The video covers topics related to statistics, focusing on measures of central tendency, including mean, median, and mode, with practical examples and explanations for both individual and grouped data.
What is the definition of the mean (average)?
-The mean is the average of a set of values, calculated by dividing the sum of all data points by the total number of data points.
How is the mean calculated for grouped data?
-For grouped data, the mean is calculated by multiplying the frequency of each class interval by its midpoint, summing these values, and dividing by the total frequency.
What does 'rataan sementara' (interim mean) refer to, and how is it used?
-'Rataan sementara' refers to an interim mean used in the calculation for grouped data. It's used to simplify the process of finding the mean by first selecting one class as the reference point and adjusting the data accordingly.
How do you calculate the median for grouped data?
-To calculate the median for grouped data, first determine the class containing the median by finding the cumulative frequency. Then, apply the formula involving the lower boundary of the median class, the cumulative frequency, and the class frequency.
What is the mode, and how is it determined for data?
-The mode is the value that appears most frequently in a dataset. For grouped data, it is found by identifying the class with the highest frequency and using a specific formula to determine the mode's value.
Can you provide an example of how to calculate the mean for a set of individual data?
-For example, for the data set 8, 6, 7, 9, 10, the mean is calculated by adding the values (8+6+7+9+10 = 40) and dividing by the number of data points (5), resulting in a mean of 8.
How do you calculate the median for an odd set of data?
-For an odd set of data, the median is the middle value when the data is arranged in order. For example, with the ordered data 2, 3, 4, 5, 6, the median is the third value, 4.
What is the formula for calculating the median in a grouped frequency table?
-The median for grouped data is calculated using the formula: median = lower boundary of the median class + [(N/2 - cumulative frequency before the median class) / frequency of the median class] * class width.
How is the mode calculated for grouped data?
-The mode for grouped data is calculated using the formula: Mode = lower boundary of the modal class + [(f1 - f0) / (2f1 - f0 - f2)] * class width, where f1 is the frequency of the modal class, f0 is the frequency of the class before it, and f2 is the frequency of the class after it.
Outlines

This section is available to paid users only. Please upgrade to access this part.
Upgrade NowMindmap

This section is available to paid users only. Please upgrade to access this part.
Upgrade NowKeywords

This section is available to paid users only. Please upgrade to access this part.
Upgrade NowHighlights

This section is available to paid users only. Please upgrade to access this part.
Upgrade NowTranscripts

This section is available to paid users only. Please upgrade to access this part.
Upgrade NowBrowse More Related Video
Ch 3 Lecture Video, Fall 2024: Measures of Central Tendency

STATISTIKA: Ukuran gejala pusat dan ukuran letak 1

Statistika Dasar Ukuran Pemusatan Data (Mean, Modus, Median) Data Tunggal dan Data Kelompok

UKURAN PEMUSATAN DATA BERKELOMPOK | Rataan Median Modus Kuartil Desil Persentil

Statistics: The average | Descriptive statistics | Probability and Statistics | Khan Academy
Mean, Median and Mode in Statistics | Statistics Tutorial | MarinStatsLectures
5.0 / 5 (0 votes)