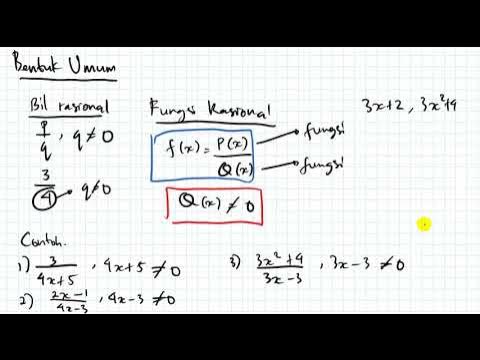
Menggambar Grafik Fungsi Rasional #fazanugas
Summary
TLDRIn this educational video, Lex Avaza teaches the process of sketching rational function graphs. The tutorial focuses on functions in the form y = (Ax + B) / (Cx + D) and outlines three key steps: identifying horizontal and vertical asymptotes, determining points of intersection with the x and y axes, and plotting these points on a Cartesian plane. A practical example is given to demonstrate the steps, guiding viewers to visualize the graph of a rational function effectively. The video also suggests using GeoGebra for more detailed graphing.
Takeaways
- 📚 The video is a tutorial on how to sketch the graph of a rational function, specifically focusing on functions in the form of y = (Ax + B) / (Cx + D).
- 📝 There are three main steps to sketch the graph of a rational function: determining the horizontal and vertical asymptotes, and identifying the points of intersection with the x and y axes.
- 📈 The horizontal asymptote is found by comparing the coefficients of x in the numerator and the denominator, resulting in the equation y = A/C.
- 🔍 The vertical asymptote is determined by setting the denominator equal to zero and solving for x, which gives the equation x = -C/D.
- 📍 To find the points of intersection with the axes, set x to zero for the y-axis and y to zero for the x-axis, then solve the function accordingly.
- 🖊️ The tutorial provides a practical example by sketching the graph of the function y = (2x - 4) / (x + 2), identifying the asymptotes and points of intersection.
- 🎨 The video instructs viewers to sketch the graph on a Cartesian plane, including the asymptotes and points of intersection, using different colors for clarity.
- 🤔 The presenter emphasizes that the graph is a sketch and not to precision, suggesting that viewers use graphing tools like GeoGebra for more accurate representations.
- 💡 The video encourages viewers to practice sketching graphs on their own and to use graphing applications for further exploration and verification.
- 🗣️ The presenter invites viewers to ask questions and engage in discussion on the topic, either in the comments section of the video or on a Telegram group.
Q & A
What is the main topic of Lex Avaza's video?
-The main topic of Lex Avaza's video is learning how to draw the graph of a rational function.
What are the three steps mentioned in the video for drawing the graph of a rational function?
-The three steps mentioned are: 1) Determine the horizontal and vertical asymptotes, 2) Identify the points of intersection with the x-axis and y-axis, and 3) Sketch the graph on the Cartesian plane.
How is the horizontal asymptote of a rational function determined?
-The horizontal asymptote is determined by comparing the coefficients of x in the numerator and the denominator. The asymptote is given by y = a/b, where 'a' is the leading coefficient of the numerator and 'b' is the leading coefficient of the denominator.
What is the formula for finding the vertical asymptote of a rational function?
-The vertical asymptote is found by setting the denominator equal to zero and solving for x. The formula is x = -c/d, where 'c' and 'd' are the coefficients from the denominator of the function.
How are the points of intersection with the x-axis and y-axis identified?
-The points of intersection with the x-axis are found by setting y to zero and solving for x. The points of intersection with the y-axis are found by setting x to zero and solving for y.
What is the domain of a rational function?
-The domain of a rational function is all real numbers except where the denominator is zero, as the function is undefined at those points.
What is the example function given in the video to demonstrate the process?
-The example function given is y = 2x - 4 / x + 2.
What are the vertical and horizontal asymptotes for the example function y = 2x - 4 / x + 2?
-The vertical asymptote for the example function is x = -2, and the horizontal asymptote is y = 2.
What is the point of intersection with the x-axis for the example function?
-The point of intersection with the x-axis for the example function is x = 2, since 2(2) - 4 / 2 + 2 = 0.
What is the point of intersection with the y-axis for the example function?
-The point of intersection with the y-axis for the example function is y = -2, since when x = 0, the function simplifies to y = -4 / 2.
What application is recommended for further graphing practice in the video?
-The video recommends using GeoGebra, a free application available on Google Play Store, for further graphing practice.
Outlines

Cette section est réservée aux utilisateurs payants. Améliorez votre compte pour accéder à cette section.
Améliorer maintenantMindmap

Cette section est réservée aux utilisateurs payants. Améliorez votre compte pour accéder à cette section.
Améliorer maintenantKeywords

Cette section est réservée aux utilisateurs payants. Améliorez votre compte pour accéder à cette section.
Améliorer maintenantHighlights

Cette section est réservée aux utilisateurs payants. Améliorez votre compte pour accéder à cette section.
Améliorer maintenantTranscripts

Cette section est réservée aux utilisateurs payants. Améliorez votre compte pour accéder à cette section.
Améliorer maintenantVoir Plus de Vidéos Connexes

Inverse of One-to-One Function | Grade 11- General Mathematics

Übersicht f f´ f´´, Zusammenhänge der Funktionen/Graphen, Ableitungsgraphen | Mathe by Daniel Jung

Representations of Rational Function

Fungsi Rasional kelas XI Matematika Tingkat Lanjut (Kurikulum Merdeka)

Tutorial Piston Head 3D - ZW3D

Introduction to Rational Function I Señor Pablo TV
5.0 / 5 (0 votes)
