Domain and Range form Graphs (Interval Notation)
Summary
TLDRThis educational video script focuses on teaching the concepts of domain and range in graphing. It explains that domain refers to the set of all possible x-values, typically represented on the x-axis, while range consists of all possible y-values on the y-axis. The script guides viewers through determining domain and range by examining various graphs, emphasizing the use of interval notation and the significance of open and closed dots on the graph to decide whether to use parentheses or brackets. It covers different scenarios, including graphs with arrows indicating infinity and those with single points, providing a comprehensive understanding of these fundamental graphing concepts.
Takeaways
- 📊 The domain of a graph represents the set of all possible x-values, which corresponds to the x-axis.
- 📈 The range of a graph represents the set of all possible y-values, which corresponds to the y-axis.
- 🔢 Domain and range are typically expressed in interval notation, reflecting the order from least to greatest value.
- ⏹ For domain, closed dots on the graph indicate inclusion, thus using brackets [ ], while open dots suggest exclusion, using parentheses ( ).
- 🔄 When determining domain, consider the farthest left and right points of the graph, including any arrows that might indicate infinity.
- 🔺 For range, look for the lowest and highest points on the graph, noting whether they are closed or open to determine the use of brackets or parentheses.
- 🔄 Infinite values in the domain or range are denoted with parentheses, indicating the function continues indefinitely in that direction.
- 🔍 Single point graphs, like letter C, have a domain of a single value, and the range is also a single value if it's a horizontal line.
- 📐 Graphs with no visible end points, like letter E, have a domain and range that extend to positive and negative infinity.
- 🔗 Understanding the difference between closed and open dots is crucial for accurately determining the domain and range of a graph.
Q & A
What is the domain of a graph?
-The domain of a graph refers to the set of all possible x-values, which is represented along the x-axis.
How do you represent the domain in interval notation?
-The domain is written in interval notation from the least to the greatest value, similar to a number line, using parentheses or brackets to indicate if the endpoints are included or not.
What is the difference between a parenthesis and a bracket in interval notation?
-A parenthesis ( ) indicates that the endpoint is not included in the interval, while a bracket [ ] indicates that the endpoint is included.
For the graph labeled 'A', what is the domain?
-The domain for graph 'A' is from negative six to positive six, inclusive of both endpoints, represented as [-6, 6].
How do you determine if an endpoint in the domain is included or not?
-An endpoint in the domain is included if it is a closed dot on the graph, and not included if it is an open dot.
What is the domain for the graph labeled 'B'?
-The domain for graph 'B' is from negative seven to positive five, where negative seven is included and positive five is not, represented as [-7, 5).
For a graph that has a single x-value, like graph 'C', what is the domain?
-For graph 'C', which has only one x-value, the domain is just that single value, represented as {-5}.
What does an arrow extending off the graph indicate for the domain?
-An arrow extending off the graph indicates that the domain continues indefinitely in that direction, either towards positive or negative infinity.
How is the range of a graph defined?
-The range of a graph is the set of all possible y-values, which is represented along the y-axis, from the lowest to the highest point of the graph.
For the graph labeled 'D', what is the range?
-The range for graph 'D' is from negative four to positive four, inclusive of both endpoints, represented as [-4, 4].
What if a graph has no highest or lowest point, like graph 'E'?
-If a graph has no highest or lowest point, its range extends from negative infinity to positive infinity, represented as (-∞, ∞).
Outlines

Cette section est réservée aux utilisateurs payants. Améliorez votre compte pour accéder à cette section.
Améliorer maintenantMindmap

Cette section est réservée aux utilisateurs payants. Améliorez votre compte pour accéder à cette section.
Améliorer maintenantKeywords

Cette section est réservée aux utilisateurs payants. Améliorez votre compte pour accéder à cette section.
Améliorer maintenantHighlights

Cette section est réservée aux utilisateurs payants. Améliorez votre compte pour accéder à cette section.
Améliorer maintenantTranscripts

Cette section est réservée aux utilisateurs payants. Améliorez votre compte pour accéder à cette section.
Améliorer maintenantVoir Plus de Vidéos Connexes

Graphing Piecewise Functions, Domain & Range - Limits, Continuity, & Absolute Value ,

Trigonometri Matematika Kelas 10 • Part 32: Menggambar Grafik Fungsi y=cos x dengan Lingkaran Satuan

Graphing Rational Functions Using Transformations With Vertical and Horizontal Asymptotes

Piecewise Function Domain Range Quadratic Linear Constant

#4 Grafik & Fungsi | KALKULUS

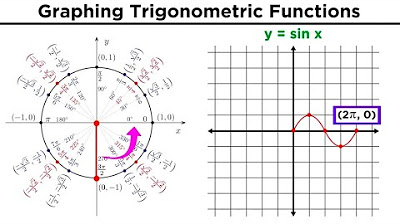
Graphing Trigonometric Functions
5.0 / 5 (0 votes)
