Graphing Piecewise Functions, Domain & Range - Limits, Continuity, & Absolute Value ,
Summary
TLDRThis video focuses on graphing piecewise functions, identifying their domain and range, and analyzing limits and continuity. It explains how to graph different functions, such as quadratic and linear equations, and combine them to form a piecewise function. The video demonstrates jump and infinite discontinuities, and shows how to evaluate the domain and range of these functions. Additionally, the limits at various points and the behavior of the function as it approaches infinity or zero are discussed. The tutorial also includes practical examples to help viewers understand the concepts of continuity, limits, and discontinuities in piecewise functions.
Takeaways
- 😀 Understand how to graph piecewise functions by breaking them into their individual parts (e.g., x² and 3/4x - 2).
- 😀 A piecewise function is graphed by combining multiple individual functions, with open or closed circles depending on whether the value is included.
- 😀 The domain of a piecewise function includes all possible x values that the function can take, and is often from negative infinity to infinity unless restricted by specific conditions.
- 😀 The range of a piecewise function represents the possible y values, which may be limited by the behavior of the individual functions.
- 😀 A jump discontinuity occurs when the graph ‘jumps’ from one value to another, and can be detected when two pieces of the function do not meet at a given x value.
- 😀 When analyzing limits for piecewise functions, the limits as x approaches infinity (both positive and negative) indicate the end behavior of the graph.
- 😀 Limits at a specific point are determined by checking the value of the function from the left and right sides of the point. If the two values differ, the limit does not exist.
- 😀 The domain of a function can be affected by discontinuities, such as a vertical asymptote or gaps in the graph, which must be excluded from the domain.
- 😀 For piecewise functions with absolute values or square roots, analyze the function at boundary points (like x = 1 or x = 0) to determine whether points are included or excluded from the graph.
- 😀 When determining the range of a piecewise function, look at the y values corresponding to the domain, and identify any values that the function cannot take based on the graph's behavior.
Q & A
What is a piecewise function and how is it graphed?
-A piecewise function is a function defined by different expressions or formulas over different intervals of the domain. To graph a piecewise function, you graph each piece separately over its specified domain and then combine them into a single graph, carefully noting where each piece starts and ends, including open or closed circles where applicable.
How do you graph the piecewise function f(x) = x^2 for x < 0 and f(x) = (3/4)x - 2 for x ≥ 0?
-To graph this function, first graph x^2 for x < 0, which is a parabola that only includes the left side. Then, graph (3/4)x - 2 for x ≥ 0, which is a straight line starting at the point (0, -2). The two graphs are connected by combining them at x = 0, with an open circle at (0, 0) for x^2 and a closed circle at (0, -2) for the line.
What type of discontinuity is present in the piecewise function f(x) = x^2 for x < 0 and f(x) = (3/4)x - 2 for x ≥ 0?
-The function has a jump discontinuity at x = 0 because the graph jumps from a y-value of 0 (from the x^2 part) to -2 (from the linear part) at this point.
What is the domain of the function f(x) = x^2 for x < 0 and f(x) = (3/4)x - 2 for x ≥ 0?
-The domain of the function is all real numbers, from negative infinity to positive infinity, because x can take any value without restrictions in either part of the function.
What is the range of the piecewise function f(x) = x^2 for x < 0 and f(x) = (3/4)x - 2 for x ≥ 0?
-The range of the function is [-2, ∞), since the lowest value of y is -2 (from the linear function at x = 0), and the graph increases without bound as x increases.
What does it mean when the limit as x approaches 0 from the left and right do not match in a piecewise function?
-When the left-hand and right-hand limits at a point do not match, the limit at that point does not exist. This indicates a discontinuity in the graph, which in this case is a jump discontinuity.
How do you graph the piecewise function f(x) = 1/x for x < 0 and f(x) = √x for x ≥ 0?
-To graph this piecewise function, first graph 1/x for x < 0, which has a vertical asymptote at x = 0 and decreases towards negative infinity as x approaches 0 from the left. Then, graph √x for x ≥ 0, starting from the origin and increasing gradually to the right. There is a jump discontinuity between x = 0 and x = 1, and the function does not exist between these points.
What is the domain of the piecewise function f(x) = 1/x for x < 0 and f(x) = √x for x ≥ 0?
-The domain is (-∞, 0) ∪ (1, ∞), as the function is undefined between 0 and 1, with a vertical asymptote at x = 0 and a gap in the graph between x = 0 and x = 1.
What is the range of the piecewise function f(x) = 1/x for x < 0 and f(x) = √x for x ≥ 0?
-The range of the function is (-∞, 0) ∪ (1, ∞), as the function takes all y-values except those between 0 and 1. It decreases without bound for 1/x and increases without bound for √x.
How do you analyze the limits of a piecewise function?
-To analyze the limits of a piecewise function, examine the behavior of the function as x approaches specific points from the left and right. If the function approaches the same value from both sides, the limit exists. If not, the limit does not exist, and you may have a discontinuity such as a jump or infinite discontinuity.
Outlines

This section is available to paid users only. Please upgrade to access this part.
Upgrade NowMindmap

This section is available to paid users only. Please upgrade to access this part.
Upgrade NowKeywords

This section is available to paid users only. Please upgrade to access this part.
Upgrade NowHighlights

This section is available to paid users only. Please upgrade to access this part.
Upgrade NowTranscripts

This section is available to paid users only. Please upgrade to access this part.
Upgrade NowBrowse More Related Video
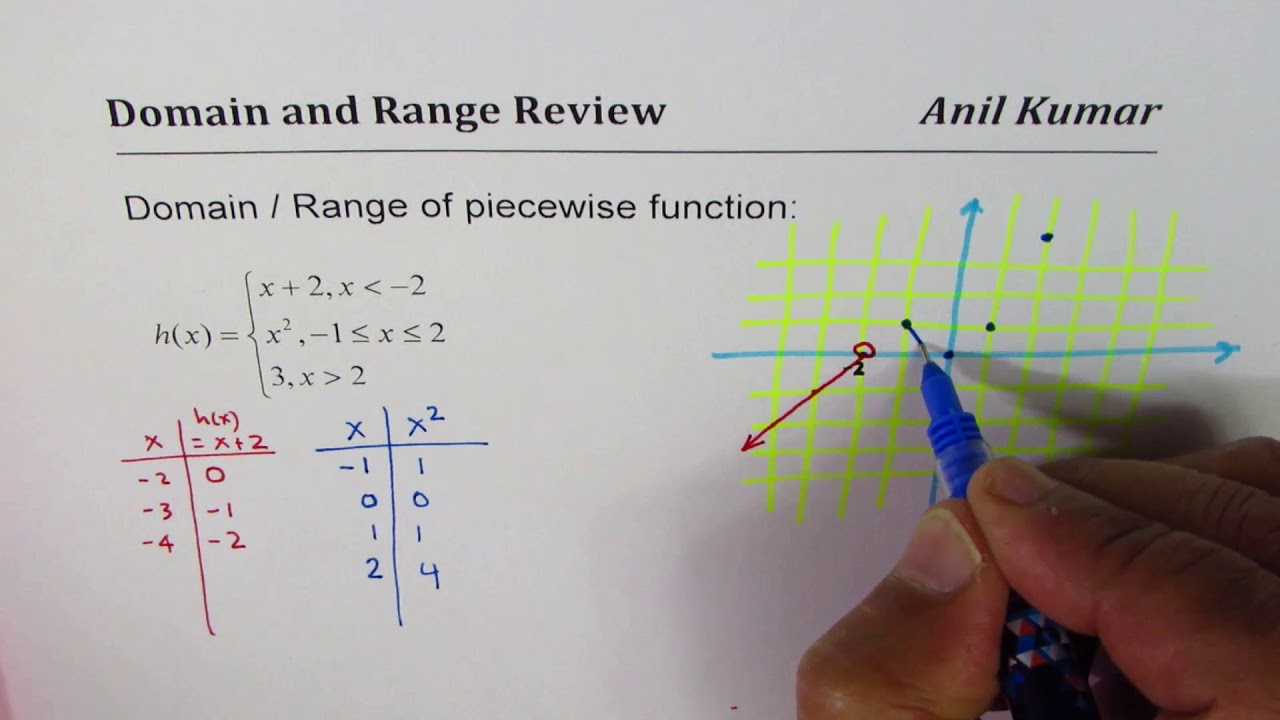
Piecewise Function Domain Range Quadratic Linear Constant
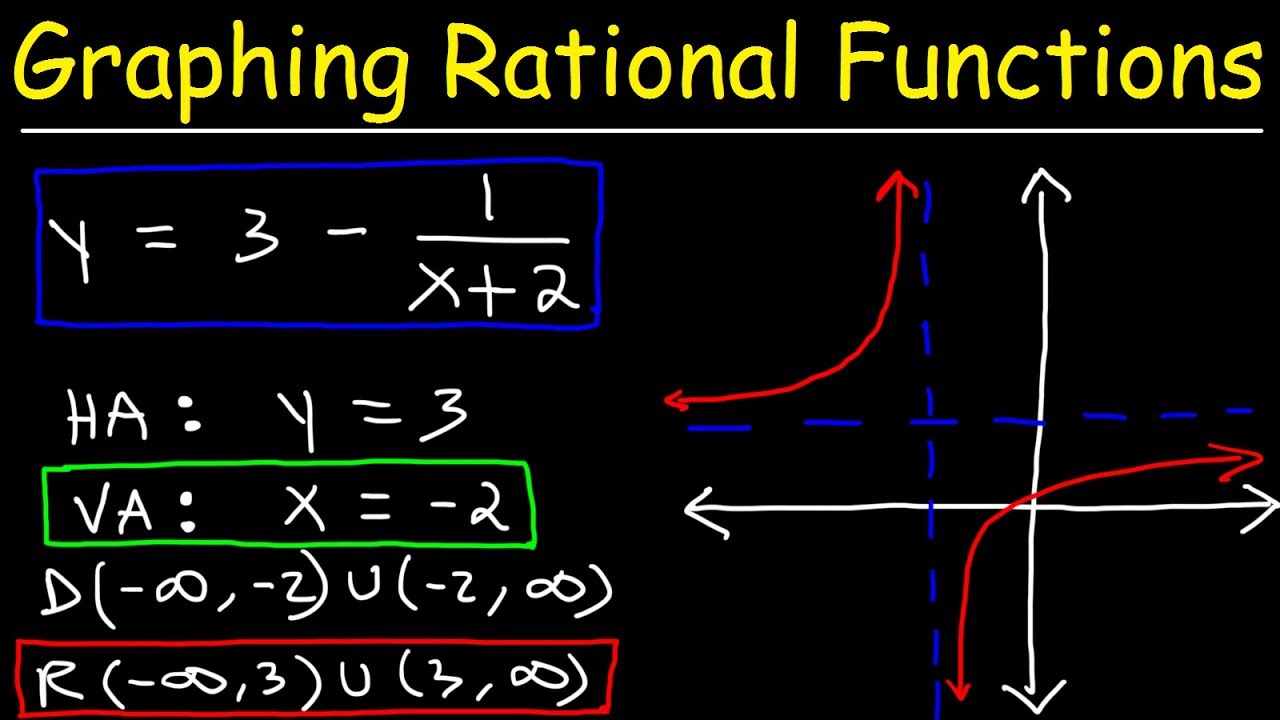
Graphing Rational Functions Using Transformations With Vertical and Horizontal Asymptotes

Continuity Basic Introduction, Point, Infinite, & Jump Discontinuity, Removable & Nonremovable

Relasi dan Fungsi Matematika Kelas 10 • Part 12: Fungsi Sepotong-Sepotong / Piecewise Function

Menggambar fungsi piecewise, linear dan kuadrat, by Top Mat

Menggambar Grafik Fungsi Piecewise
5.0 / 5 (0 votes)