pivot tabel, informatika Kl 8 bab 6 Analisis Data kurikulum Merdeka bag 37 hal 149 153
Summary
TLDRThis tutorial covers the essentials of creating and using a one-dimensional Pivot Table in Excel to summarize large datasets. It demonstrates how to analyze data such as tourist numbers from various regions and years. The video explains how to filter data, use different summary functions like sum, count, or average, and adjust Pivot Table settings for tailored results. Viewers learn step-by-step how to organize data into rows, columns, and values, making it easier to analyze complex data in a concise format. Ideal for beginners looking to streamline data analysis with Pivot Tables.
Takeaways
- 😀 Pivot tables are used to summarize and analyze large datasets, making it easier to view specific details of interest.
- 😀 In a one-dimensional Pivot table, data from one column of a dataset is summarized, typically as rows.
- 😀 Data in the Pivot table can be filtered to display specific information, such as summarizing data for a specific person or category.
- 😀 You can calculate statistics like averages, sums, or counts in a Pivot table to analyze the data more efficiently.
- 😀 Pivot tables automatically aggregate data, showing only distinct entries for repeated values.
- 😀 Filters can be applied to focus on specific data points, such as filtering by name or year, for a more tailored analysis.
- 😀 In Excel, the 'Insert' menu provides the option to create Pivot tables from your dataset, where you can choose the data source and placement location.
- 😀 Pivot tables allow users to drag and drop fields into different areas (rows, values, and filters) to customize the table's structure.
- 😀 Pivot tables can be used to calculate various statistical functions like average, count, max, and sum by changing the value field settings.
- 😀 You can filter data by year or other categories to compare different time periods or conditions, such as comparing the total number of visitors across different years.
- 😀 Pivot tables help to efficiently analyze complex data by summarizing it in a compact, easy-to-read format with interactive filtering options.
Q & A
What is a one-dimensional Pivot Table used for?
-A one-dimensional Pivot Table is used to summarize data from a large dataset by focusing on specific parts of the data, allowing for better analysis and insights.
How does the data appear in a one-dimensional Pivot Table?
-In a one-dimensional Pivot Table, the data will appear as summarized rows based on a single column from the dataset, such as the region or subject, and statistical functions will be applied to other columns, like the number of tourists.
What are the main columns in the dataset used for creating a Pivot Table in the video example?
-The main columns in the dataset used for creating the Pivot Table are 'year,' 'country,' 'region,' and 'number of tourists.'
How do you select the data for creating a Pivot Table?
-To create a Pivot Table, click on any cell within the dataset and then use the 'Insert' tab in Excel, selecting 'Pivot Table' to begin the process.
What is the default location for a Pivot Table when created?
-By default, the Pivot Table will be placed in a new worksheet. However, it can also be placed in an existing worksheet if needed.
What fields are typically used in a one-dimensional Pivot Table, according to the script?
-Typical fields used in a one-dimensional Pivot Table include the 'region' field for rows, and the 'tourist numbers' field for values, with optional filters for year or other categories.
What calculation functions are available for summarizing data in a Pivot Table?
-The available functions for summarizing data in a Pivot Table include 'SUM,' 'COUNT,' 'AVERAGE,' 'MAX,' 'MIN,' among others. Users can select the desired function based on the analysis needs.
How can you change the summary function in a Pivot Table?
-To change the summary function, right-click on a value in the Pivot Table, select 'Value Field Settings,' and choose the desired calculation function, such as 'Average' or 'Count.'
How can you filter data in a Pivot Table based on year or other criteria?
-You can filter data in a Pivot Table by selecting a drop-down filter for the 'year' or other fields, allowing you to view data for specific years or categories, such as '2017' or '2018.'
What is the advantage of using a Pivot Table in data analysis?
-The advantage of using a Pivot Table is that it helps in quickly summarizing, analyzing, and interpreting large datasets, allowing users to easily perform calculations and filtering based on their analysis needs.
Outlines

Dieser Bereich ist nur für Premium-Benutzer verfügbar. Bitte führen Sie ein Upgrade durch, um auf diesen Abschnitt zuzugreifen.
Upgrade durchführenMindmap

Dieser Bereich ist nur für Premium-Benutzer verfügbar. Bitte führen Sie ein Upgrade durch, um auf diesen Abschnitt zuzugreifen.
Upgrade durchführenKeywords

Dieser Bereich ist nur für Premium-Benutzer verfügbar. Bitte führen Sie ein Upgrade durch, um auf diesen Abschnitt zuzugreifen.
Upgrade durchführenHighlights

Dieser Bereich ist nur für Premium-Benutzer verfügbar. Bitte führen Sie ein Upgrade durch, um auf diesen Abschnitt zuzugreifen.
Upgrade durchführenTranscripts

Dieser Bereich ist nur für Premium-Benutzer verfügbar. Bitte führen Sie ein Upgrade durch, um auf diesen Abschnitt zuzugreifen.
Upgrade durchführenWeitere ähnliche Videos ansehen
Chapter 5 - Analisa Data melalui Excel | Informatika Booster
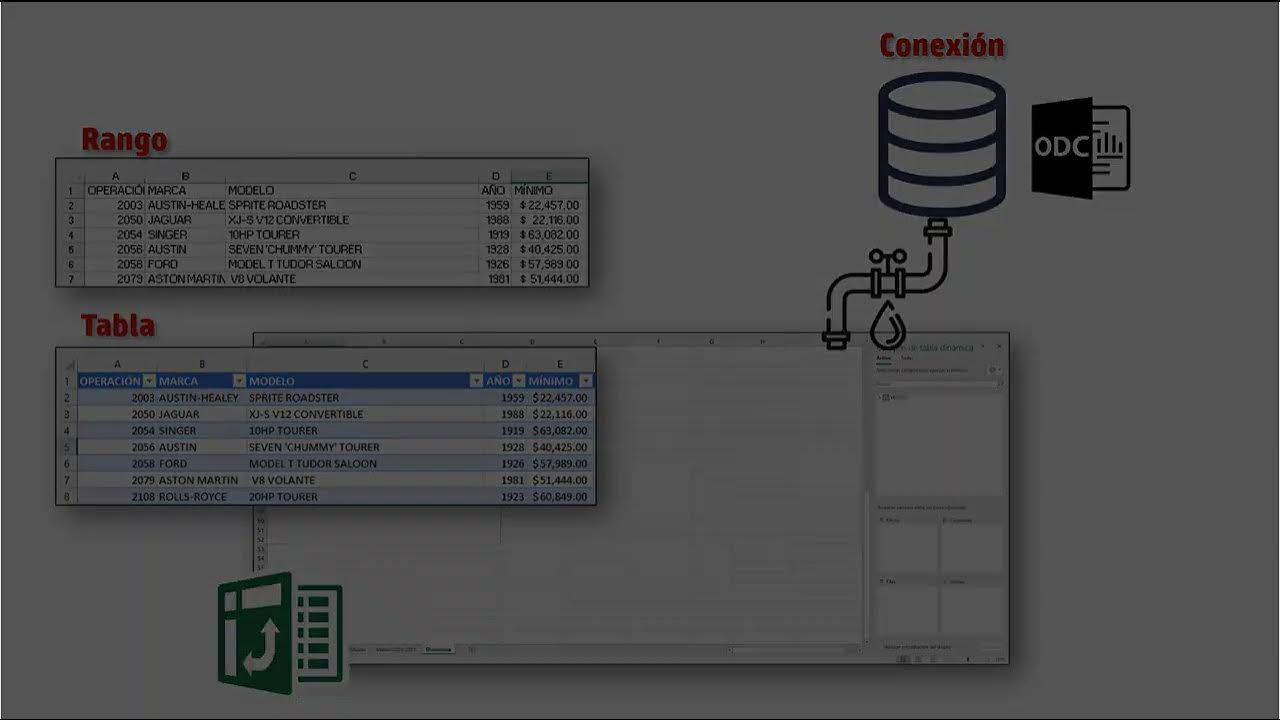
02 03 Cómo se crea una Tabla dinámica

pivot table for beginners in excel in Hindi | pivot table excel in hindi
Advanced Excel - Creating Pivot Tables in Excel

pivot dua dimensi informatika Kl 8 bab 6 Analisis Data kurikulum Merdeka bag 37 hal 153 156

How to Create MIS Report in excel | Impressive and Interactive MIS Report In Excel | Simplilearn
5.0 / 5 (0 votes)
