pivot table for beginners in excel in Hindi | pivot table excel in hindi
Summary
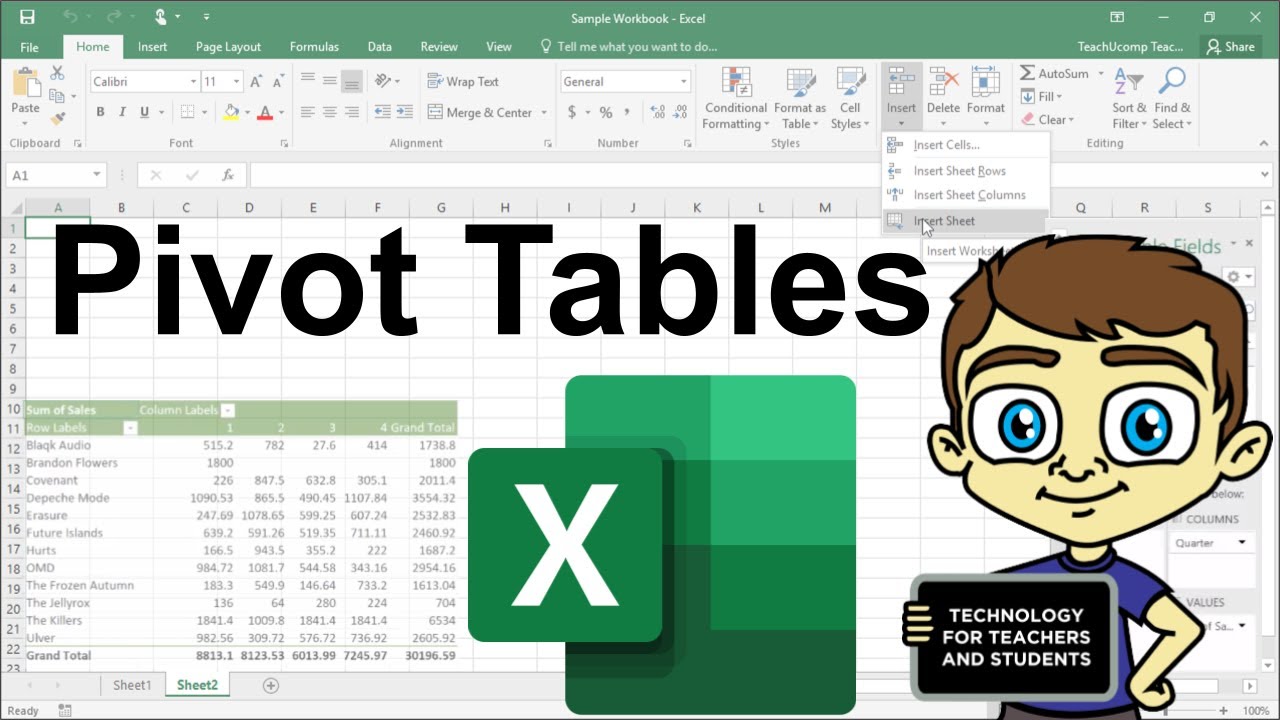
TLDRThis video provides a detailed tutorial on how to use pivot tables in Excel, a powerful tool frequently asked about in interviews. The presenter explains the importance of pivot tables when handling large datasets, and how to organize and summarize data for clear, professional reports. The video covers key features such as selecting specific fields, organizing data by department, and calculating totals or percentages. It also demonstrates how to customize reports, add filters, and format tables for easier interpretation. With practical examples, the tutorial highlights how to efficiently use pivot tables to generate insightful reports for senior management.
Takeaways
- 😀 The importance of using Pivot Tables in Excel during interviews as they are widely asked about.
- 😀 Pivot Tables help you analyze and summarize large datasets, making it easier to create and present reports to senior supervisors.
- 😀 You can quickly aggregate data by selecting specific fields like department and sales, making the task much simpler and more efficient.
- 😀 Excel provides various ways to filter and organize data based on criteria like department or date, ensuring the data is presented clearly.
- 😀 Using Pivot Tables allows you to calculate totals, percentages, and other key metrics without manually processing the data.
- 😀 With Pivot Tables, you can display data in an organized format that makes it easier for supervisors to understand and act on.
- 😀 Excel's Pivot Table interface allows for easy customization, such as changing the design or adding fields for better clarity.
- 😀 You can filter data in Pivot Tables based on multiple criteria, such as region, product, or department, to get specific insights.
- 😀 The flexibility of Pivot Tables means you can focus on only the relevant data, such as sales by department or total sales for a specific product.
- 😀 The script emphasizes that creating reports through Pivot Tables helps in presenting data in a professional and visually appealing manner.
- 😀 In Excel, users can further refine their reports by adjusting the design, layout, and filters to match their specific reporting needs.
Q & A
What is the primary function of Pivot Tables in Excel, as described in the video?
-The primary function of Pivot Tables in Excel is to organize and summarize large sets of data. This makes it easier to analyze and present the data in a report, especially when handling complex data with multiple categories.
Why are Pivot Tables considered important for professional use, particularly in interviews?
-Pivot Tables are considered important in professional settings because they allow users to efficiently summarize and analyze large data sets. This ability to quickly generate useful reports is highly valued, especially in roles that require data reporting and analysis.
How does one create a Pivot Table in Excel, based on the steps provided in the video?
-To create a Pivot Table in Excel, you need to select the data range, insert a Pivot Table, and choose the fields you want to analyze. You can then drag and drop fields into different areas, such as rows, columns, and values, to organize the data as needed.
What is the role of the 'Field List' in creating a Pivot Table?
-The 'Field List' in a Pivot Table is a panel that allows users to select and drag fields from their data into the appropriate sections (Rows, Columns, Values) to build the summary report. It helps in structuring the data for analysis.
How does the video demonstrate filtering data using Pivot Tables?
-The video shows how to use the filter option in Pivot Tables by selecting specific categories, such as department or product type, and filtering the data to display only relevant information, thus simplifying the analysis.
What is the significance of using 'Grand Total' in a Pivot Table report?
-The 'Grand Total' in a Pivot Table is used to display the overall total of all the data in the report, giving a comprehensive summary. It helps users quickly see the total figures for all categories without manually summing the data.
How can you adjust the format of a Pivot Table for better presentation, as shown in the video?
-You can adjust the format of a Pivot Table by using design options in Excel, such as changing the report layout to an outline format or applying different styles to improve the readability and visual appeal of the report.
What is the purpose of showing data in percentages in a Pivot Table, as explained in the video?
-Displaying data in percentages in a Pivot Table helps in understanding the relative proportions of different values in the data set. It provides a clearer view of how each category compares to the whole, making the analysis easier.
What should you do if you need to remove specific fields from the Pivot Table, based on the video instructions?
-To remove specific fields from a Pivot Table, you can simply uncheck the field from the 'Field List' or drag it out of the Pivot Table layout, making the table more focused on the required data.
What kind of practical scenarios did the video cover for using Pivot Tables in a real-world job setting?
-The video covered practical scenarios such as summarizing sales data by department, analyzing product performance, and generating reports for senior supervisors. It emphasized the ease and speed with which Pivot Tables can help produce professional reports for decision-making.
Outlines

This section is available to paid users only. Please upgrade to access this part.
Upgrade NowMindmap

This section is available to paid users only. Please upgrade to access this part.
Upgrade NowKeywords

This section is available to paid users only. Please upgrade to access this part.
Upgrade NowHighlights

This section is available to paid users only. Please upgrade to access this part.
Upgrade NowTranscripts

This section is available to paid users only. Please upgrade to access this part.
Upgrade NowBrowse More Related Video

Data Analyst🔥Technical Interview Questions ✅ | Top 15 Questions with Answers

pivot dua dimensi informatika Kl 8 bab 6 Analisis Data kurikulum Merdeka bag 37 hal 153 156

11 Most Important Tools in Excel | Malayalam Tutorial
Advanced Excel - Creating Pivot Tables in Excel

Pivot Tables in Excel | Excel Tutorials for Beginners

Excel Tutorial - What is Excel used for?
5.0 / 5 (0 votes)