(PART 1) Koefisien Korelasi
Summary
TLDRIn this educational video, the presenter explains the concept of correlation analysis in statistics, focusing on the correlation coefficient. Viewers learn how to interpret the values of the correlation coefficient (r) ranging from -1 to 1, indicating perfect positive, negative, or no correlation between variables. Examples are given to show how correlation is used in real-life scenarios, like the relationship between police patrols and crime rates. The video also covers the Pearson correlation coefficient formula and walks through a sample calculation to demonstrate how to apply it in research.
Takeaways
- 😀 Correlation analysis is a statistical method used to study the relationship between two or more variables.
- 😀 The correlation coefficient (denoted as 'r') measures the strength, direction, and intensity of the relationship between two variables.
- 😀 The value of the correlation coefficient ranges from -1 to 1, where: 1 indicates perfect positive correlation, -1 indicates perfect negative correlation, and 0 means no correlation.
- 😀 A positive correlation means that as one variable increases, the other also tends to increase, though not necessarily perfectly.
- 😀 A negative correlation means that as one variable increases, the other tends to decrease.
- 😀 The strength of the correlation is categorized as follows: weak (r between -0.3 and 0.3), moderate (r between -0.7 and 0.7), strong (r between -1 and -0.7 or 0.7 and 1), and perfect (r = -1 or r = 1).
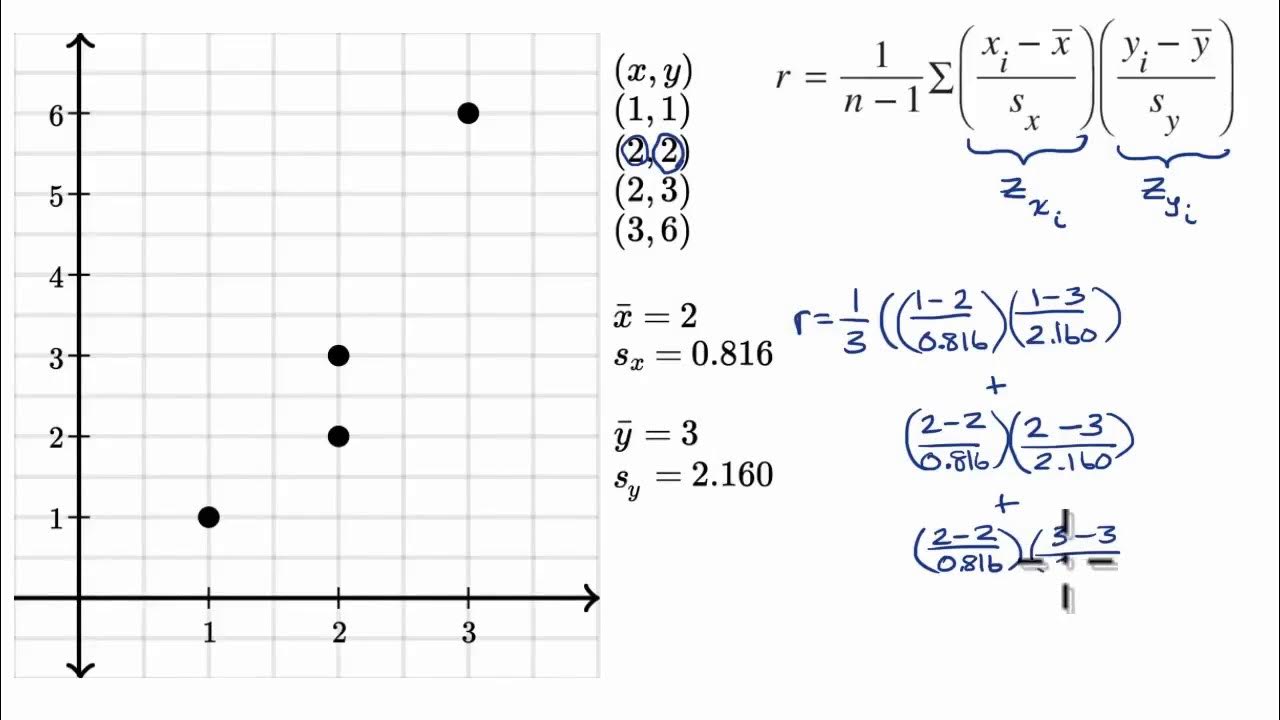
- 😀 The formula for calculating the correlation coefficient is based on Pearson's product-moment correlation method.
- 😀 The Pearson's correlation coefficient is calculated using the formula: R = (N * ΣXY - ΣX * ΣY) / √[(N * ΣX² - (ΣX)²) * (N * ΣY² - (ΣY)²)] where N is the number of data points, X is the independent variable, and Y is the dependent variable.
- 😀 A correlation coefficient of r = -0.75 suggests a strong negative relationship, as seen in the example with police patrols and crime reports.
- 😀 For accurate data analysis, further investigation and analysis are needed beyond just the initial correlation coefficient, especially to determine causal relationships.
Q & A
What is the purpose of correlation analysis in statistics?
-The purpose of correlation analysis is to study the relationship between two or more variables and to measure the strength and direction of that relationship, often represented by a correlation coefficient.
How is the correlation coefficient (r) interpreted?
-The correlation coefficient (r) ranges from -1 to 1. r = 1 indicates a perfect positive correlation, r = -1 indicates a perfect negative correlation, r = 0 indicates no correlation, 0 < r < 1 indicates a positive correlation, and -1 < r < 0 indicates a negative correlation.
What are some practical examples of correlation analysis?
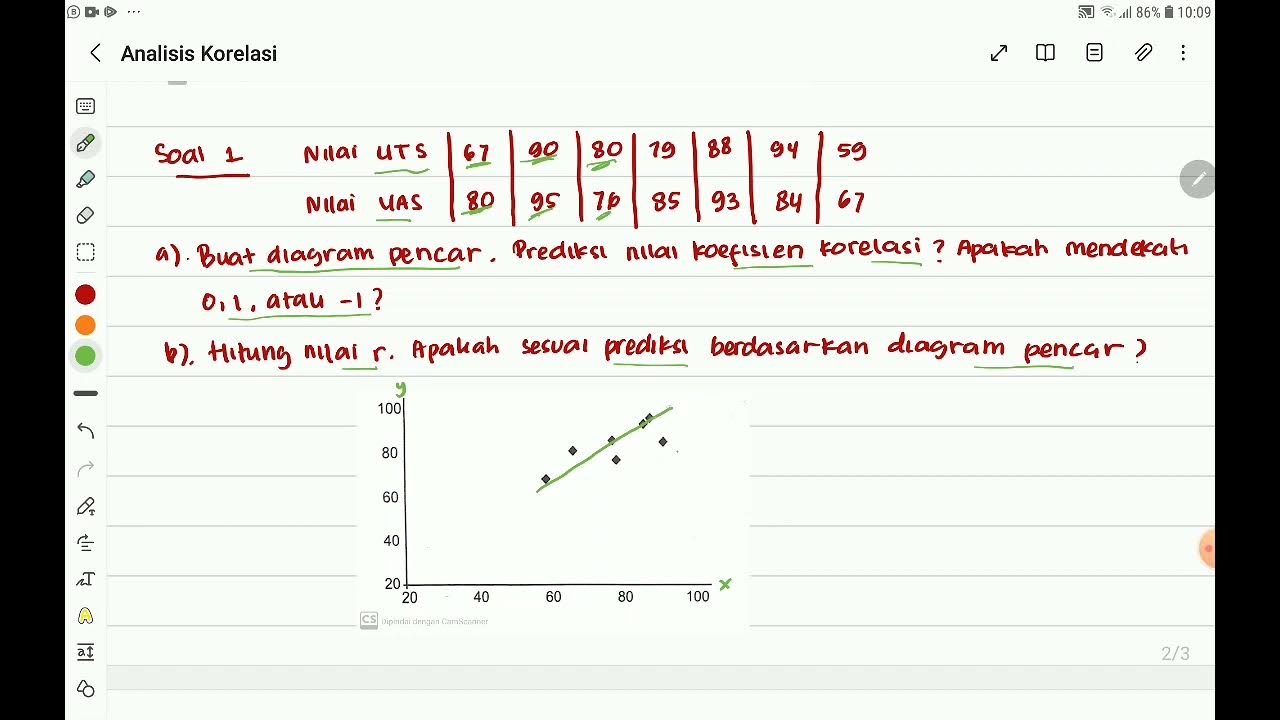
-Practical examples include studying the relationship between students' math scores and their intelligence, or analyzing the connection between rainfall intensity and ice cream sales.
What does a correlation coefficient of r = 0.829 indicate?
-A correlation coefficient of r = 0.829 indicates a strong positive correlation, meaning that as one variable increases, the other variable is likely to increase as well, though not perfectly.
What is the difference between a perfect correlation and a strong correlation?
-A perfect correlation (r = 1 or r = -1) means that the relationship between variables is exact and predictable. A strong correlation (e.g., r = 0.7 to 0.99 or r = -0.7 to -0.99) indicates a strong relationship but with some variability or deviation.
Which method is commonly used to calculate the correlation coefficient?
-The Pearson Product Moment Correlation Coefficient method is commonly used to calculate the correlation coefficient. It does not require data modification and is straightforward to apply.
What is the formula for the Pearson correlation coefficient?
-The Pearson correlation coefficient formula is: r = (n∑XY - ∑X∑Y) / √[(n∑X² - (∑X)²)(n∑Y² - (∑Y)²)], where X is the independent variable, Y is the dependent variable, and n is the number of data points.
How do you interpret a correlation coefficient of r = -0.75?
-A correlation coefficient of r = -0.75 indicates a strong negative correlation, meaning that as one variable increases, the other variable tends to decrease significantly but not perfectly.
What are the levels of correlation strength according to the value of r?
-Correlation strength levels are: 0 = no correlation, -0.3 to 0.3 = weak correlation, -0.7 to -0.3 or 0.3 to 0.7 = moderate correlation, -1 to -0.7 or 0.7 to 1 = strong correlation, -1 or 1 = perfect correlation.
Why is the correlation coefficient only an initial indicator?
-The correlation coefficient is only an initial indicator because it shows association, not causation. Further analysis is required to determine cause-and-effect relationships between variables.
What is the difference between independent and dependent variables in correlation analysis?
-In correlation analysis, the independent variable (X) is the one assumed to influence or predict changes in another variable, while the dependent variable (Y) is the outcome or response that is measured.
How can correlation analysis be useful in real-world research?
-Correlation analysis helps researchers identify patterns, predict outcomes, and make informed decisions. For example, it can be used to determine the impact of police patrol frequency on crime rates or to assess the relationship between study hours and exam scores.
Outlines

هذا القسم متوفر فقط للمشتركين. يرجى الترقية للوصول إلى هذه الميزة.
قم بالترقية الآنMindmap

هذا القسم متوفر فقط للمشتركين. يرجى الترقية للوصول إلى هذه الميزة.
قم بالترقية الآنKeywords

هذا القسم متوفر فقط للمشتركين. يرجى الترقية للوصول إلى هذه الميزة.
قم بالترقية الآنHighlights

هذا القسم متوفر فقط للمشتركين. يرجى الترقية للوصول إلى هذه الميزة.
قم بالترقية الآنTranscripts

هذا القسم متوفر فقط للمشتركين. يرجى الترقية للوصول إلى هذه الميزة.
قم بالترقية الآنتصفح المزيد من مقاطع الفيديو ذات الصلة
Analisis Korelasi "Nilai Koefisien Korelasi dan Tingkat Korelasi" Part 1 Mtk 11 SMA Kmerdeka
Korelasi Spearman - Matematika Wajib SMA Kelas XI Kurikulum Merdeka

KULIAH STATISTIK - ANALISIS KORELASI

Regresi dan Korelasi Sederhana
Cálculo del coeficiente de correlación r | Khan Academy en Español
What haunts statisticians at night
5.0 / 5 (0 votes)
