Analisis Korelasi "Nilai Koefisien Korelasi dan Tingkat Korelasi" Part 1 Mtk 11 SMA Kmerdeka
Summary
TLDRIn this educational video, the topic of correlation analysis is explored, building upon previous lessons on linear regression. The concept of correlation, its definition, and types are introduced, focusing on the product-moment correlation. Key formulas for calculating correlation coefficients are explained, with practical examples for computing values. The video also discusses interpreting correlation values, from perfect positive correlation to negative correlation, and how to assess the strength of relationships. The presenter provides step-by-step exercises on calculating the correlation coefficient and understanding its implications, ensuring viewers grasp both the theory and application of statistical analysis.
Takeaways
- 😀 Correlation analysis is one of the most commonly used statistical methods to determine the relationship between variables.
- 😀 The correlation coefficient helps in determining both the direction and the strength of the relationship between two variables.
- 😀 The product moment correlation coefficient (R) can range from -1 to 1, indicating different strengths and directions of the relationship.
- 😀 A perfect positive correlation has an R value of +1, while a perfect negative correlation has an R value of -1.
- 😀 If the R value is close to 0, there is little to no correlation between the two variables.
- 😀 A positive correlation implies that as one variable increases, the other also increases, while a negative correlation indicates that as one variable increases, the other decreases.
- 😀 The correlation coefficient can be used to assess the spread of data points on a regression line, helping to predict the nature of their relationship.
- 😀 If the R value is near 1, it indicates a strong positive relationship, while a value near -1 shows a strong negative relationship.
- 😀 The script includes practical steps on how to compute the correlation coefficient using the given formulae, considering SSX, SSY, and SSXY values.
- 😀 The tutorial provides a hands-on approach to understanding the calculations by using example data sets and predicting the correlation coefficient through scatter plots.
Q & A
What is correlation analysis in statistics?
-Correlation analysis is a statistical method used to assess the relationship between two variables. It provides insights into how changes in one variable are associated with changes in another, revealing both the direction and strength of the relationship.
What is the product-moment correlation coefficient?
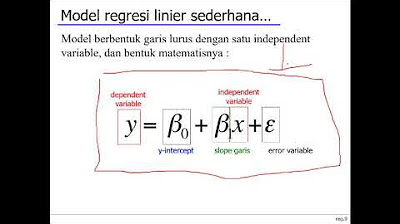
-The product-moment correlation coefficient (often denoted as 'r') is a measure that quantifies the direction and strength of a linear relationship between two variables. It ranges from -1 to +1, where +1 indicates a perfect positive correlation, -1 indicates a perfect negative correlation, and 0 indicates no linear correlation.
How is the product-moment correlation coefficient calculated?
-The product-moment correlation coefficient is calculated using the formula: r = SSxy / sqrt(SSx * SSy), where SSxy is the sum of the product of deviations of x and y from their means, SSx is the sum of squared deviations of x from its mean, and SSy is the sum of squared deviations of y from its mean.
What does a correlation coefficient close to 1 or -1 signify?
-A correlation coefficient close to +1 indicates a strong positive linear relationship between the variables, meaning that as one variable increases, the other tends to increase as well. A coefficient close to -1 suggests a strong negative linear relationship, meaning that as one variable increases, the other tends to decrease.
What does a correlation coefficient of 0 indicate?
-A correlation coefficient of 0 indicates no linear relationship between the two variables, meaning that changes in one variable do not predict or are not associated with changes in the other variable.
What are some types of correlations based on the value of r?
-The types of correlations based on the value of r include: 1) Perfect positive correlation (r = 1), 2) Strong positive correlation (r close to 1), 3) Weak positive correlation (r close to 0 but positive), 4) No correlation (r = 0), 5) Weak negative correlation (r close to 0 but negative), and 6) Strong negative correlation (r close to -1), and 7) Perfect negative correlation (r = -1).
What is the role of the scatter plot in correlation analysis?
-A scatter plot visually represents the relationship between two variables. It helps predict the direction and strength of the correlation by showing the distribution and trend of data points. A clear upward or downward trend in the scatter plot suggests a positive or negative correlation, respectively.
How do we interpret a correlation coefficient of 0.794?
-A correlation coefficient of 0.794 indicates a strong positive correlation. This means there is a significant positive relationship between the two variables, where as one variable increases, the other also tends to increase, though not perfectly.
How do you calculate the sum of squared deviations (SSx, SSy, SSxy)?
-To calculate SSx, subtract the mean of x from each x value, square the results, and sum them. Similarly, calculate SSy by subtracting the mean of y from each y value, squaring the results, and summing them. SSxy is calculated by multiplying each pair of corresponding deviations from their means (x - mean of x) * (y - mean of y), and then summing these products.
What does the table of correlation coefficients show?
-The table of correlation coefficients helps interpret the strength and direction of the correlation between two variables. It classifies the correlation as perfect, strong, moderate, or weak, depending on the value of r. A value of 0 indicates no correlation, while values close to -1 or +1 suggest stronger correlations.
Outlines

This section is available to paid users only. Please upgrade to access this part.
Upgrade NowMindmap

This section is available to paid users only. Please upgrade to access this part.
Upgrade NowKeywords

This section is available to paid users only. Please upgrade to access this part.
Upgrade NowHighlights

This section is available to paid users only. Please upgrade to access this part.
Upgrade NowTranscripts

This section is available to paid users only. Please upgrade to access this part.
Upgrade NowBrowse More Related Video
Week 6 Statistika Industri II - Analisis Regresi (part 1)

(1/4) Analisis Regresi : Uji asumsi Klasik
SPSS LENGKAP!! Perbedaan Analisis Korelasi dengan Analisis Regresi

Cara Menghitung Analisis Regresi Sederhana secara Manual

KULIAH STATISTIK - ANALISIS REGRESI
Data Mining 09 - Korelasi & Analisa Regresi (1/2)
5.0 / 5 (0 votes)