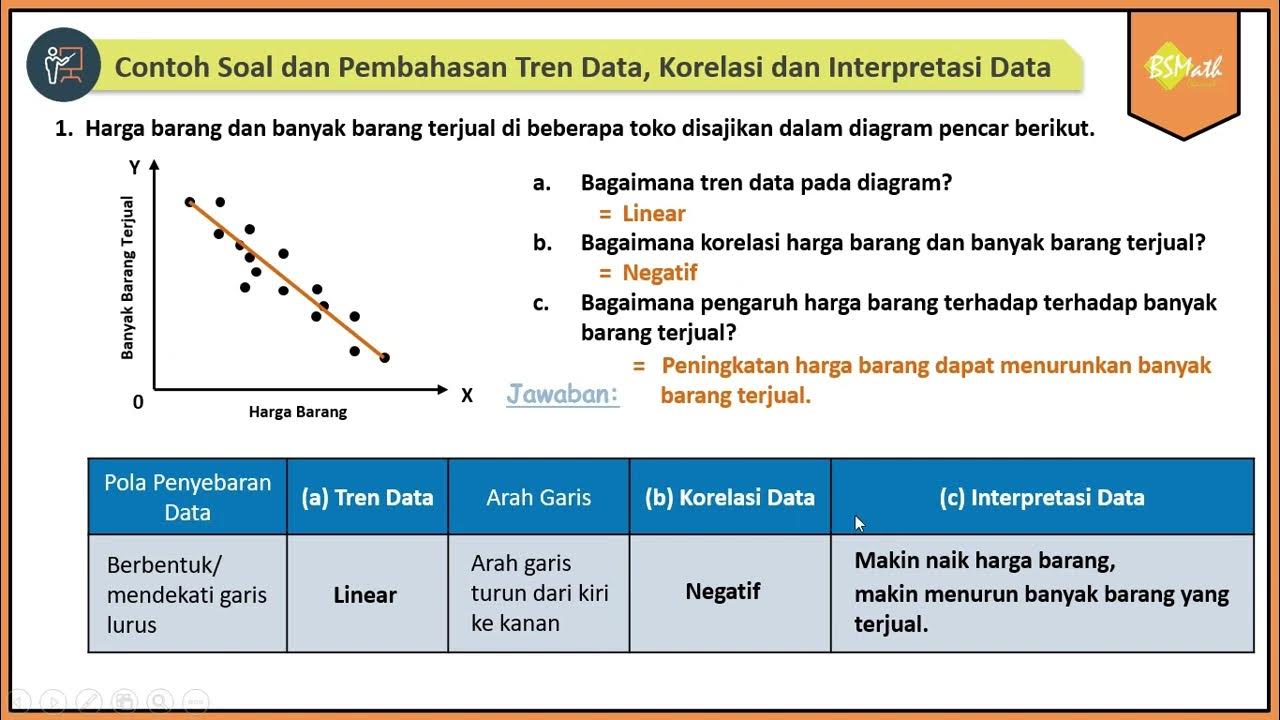
Tren Data, Korelasi dan Interpretasi Data Bivariat | Matematika Wajib SMA Kelas XI Kurikulum Merdeka
Summary
TLDRThis video explains the key concepts related to scatter diagrams, focusing on data trends, correlations, and interpretation of bivariate data. It covers the process of drawing scatter plots, identifying trends (linear, nonlinear, or no pattern), and analyzing correlations (positive, negative, or none). The video also emphasizes how to interpret the relationship between two variables, such as how changes in one might influence the other. The presenter illustrates these concepts with examples and concludes with a practice exercise to reinforce learning.
Takeaways
- 😀 Understanding scatter diagrams is crucial for analyzing data trends in statistics.
- 😀 Data trends can be linear, non-linear, or lack any specific pattern.
- 😀 A **linear trend** appears when data points form or approximate a straight line.
- 😀 A **non-linear trend** occurs when the data points form a curve or don't align with a straight line.
- 😀 When there is **no clear trend**, the data points are scattered without forming any distinct pattern.
- 😀 **Correlation** measures how closely two variables are related, based on the trend of data.
- 😀 A **positive correlation** means both variables increase or decrease together.
- 😀 A **negative correlation** means one variable increases while the other decreases.
- 😀 If the data shows no clear trend or relationship, the correlation is considered **zero**.
- 😀 **Interpretation** is the conclusion drawn from analyzing the data trends and correlations, helping to understand how variables interact.
- 😀 The process of analyzing a scatter plot involves identifying the trend first, determining the correlation, and then making an interpretation about how the variables influence each other.
Q & A
What is the main topic discussed in this video?
-The main topic discussed is the analysis of scatter plots, specifically focusing on trends, correlation, and interpretation of bivariate data.
What are the three forms of data trends explained in the video?
-The three forms of data trends are: linear, curvilinear (nonlinear), and no clear pattern (no trend).
How is a linear data trend identified in a scatter plot?
-A linear data trend is identified when the pattern of data points forms or closely approximates a straight line.
What is the purpose of analyzing the trend in bivariate data?
-The purpose of analyzing the trend is to identify patterns or directions in the data, which could help predict future behavior or understand relationships between variables.
What does a positive correlation indicate in a scatter plot?
-A positive correlation indicates that as one variable increases, the other variable also increases, with both variables moving in the same direction.
What does a negative correlation mean in a scatter plot?
-A negative correlation means that as one variable increases, the other variable decreases, showing an inverse relationship between the two variables.
When is correlation considered to be 'zero' or 'no correlation'?
-Correlation is considered to be zero or no correlation when there is no apparent relationship or pattern between the two variables in the scatter plot.
What is the role of interpretation in data analysis?
-Interpretation is the process of drawing conclusions from the data analysis, summarizing the trends, correlations, and the relationship between the variables.
What are the steps involved in analyzing a scatter plot for trends and correlations?
-The steps are: 1) Identify the data trend (linear, curvilinear, or no pattern), 2) Determine the direction of the trend (positive or negative), 3) Analyze the correlation, and 4) Interpret the data for conclusions.
What happens when the data points in a scatter plot do not follow any discernible pattern?
-When the data points do not follow any discernible pattern, the trend is considered to have no clear shape, and the correlation is considered zero or nonexistent, meaning the variables do not influence each other.
Outlines

هذا القسم متوفر فقط للمشتركين. يرجى الترقية للوصول إلى هذه الميزة.
قم بالترقية الآنMindmap

هذا القسم متوفر فقط للمشتركين. يرجى الترقية للوصول إلى هذه الميزة.
قم بالترقية الآنKeywords

هذا القسم متوفر فقط للمشتركين. يرجى الترقية للوصول إلى هذه الميزة.
قم بالترقية الآنHighlights

هذا القسم متوفر فقط للمشتركين. يرجى الترقية للوصول إلى هذه الميزة.
قم بالترقية الآنTranscripts

هذا القسم متوفر فقط للمشتركين. يرجى الترقية للوصول إلى هذه الميزة.
قم بالترقية الآنتصفح المزيد من مقاطع الفيديو ذات الصلة

Menggambar Diagram Pencar Kelas XI Fase F Kurikulum Merdeka

ASESMEN TENGAH SEMESTER PILGAN NO.1-10 HAL.21-23 MAT.WAJIB KLS 11B DIAGRAM PENCAR PR INTAN PARIWARA

Statistika Bivariat: Mengungkap Hubungan Dua Variabel!

Pembahasan Soal Asesmen Akhir Semester Materi Diagram Pencar Nomor 1-5 | Matematika Wajib Kelas XI

Statistik Teori pertemuan ke ~ 9 Korelasi dan Regresi

Contoh Soal dan Pembahasan Tren Data, Korelasi dan Interpretasi Data Bivariat Diagram Pencar
5.0 / 5 (0 votes)
