4 Analyse The Viability Of A Network Using An Angular Segment Analysis Depthmap
Summary
TLDRThis tutorial demonstrates how to test the viability of a network using Angular Segment Analysis in Depth Map. By selecting a segment and evaluating it using angular and metric step methods, users can assess network connectivity from a specific point. The video guides through the steps of running the analysis, interpreting results based on busyness and integration, and adjusting settings for optimal visualization. Additionally, it covers exporting the analysis in various formats, such as EPS, CSV, and Maya File, allowing for further examination and improvement of network accessibility.
Takeaways
- 😀 Select the area to test connectivity by clicking and dragging to highlight the segment in yellow.
- 😀 Use the Segment Step Ducts tool to run Angular, Topological, or Metric Step analyses to evaluate network connectivity.
- 😀 Angular Step analysis shows how many road segments are needed to reach each destination from the chosen segment.
- 😀 Topological Step analysis displays the number of directional changes of streets to reach the selected segment.
- 😀 Metric Step analysis evaluates the distance (metric value) between streets from the chosen segment.
- 😀 After performing the analysis, areas are color-coded: blue for connected, orange/red for partial connection, and gray for disconnected segments.
- 😀 The Angular Segment Analysis tool runs a detailed evaluation from a selected segment to other segments, factoring in transport modes like pedestrian or cyclist.
- 😀 You can adjust the refinement value for the analysis, affecting the accuracy and time taken for the evaluation.
- 😀 Integration and choice values indicate how well segments are connected and how busy the network is in various areas.
- 😀 Export results in various formats such as EPS for Illustrator, CSV for analysis, or MIF for QGIS import.
- 😀 Adjust the color range and mode to better visualize network data, allowing for clearer distinctions between connected and disconnected areas.
Q & A
What is the purpose of the angular segment analysis in this tutorial?
-The angular segment analysis helps test how viable a network is from a specific point by evaluating the connectivity and accessibility of a network using various metrics.
How do you select the area you want to test in the network?
-You can select the area by clicking and dragging with the arrow icon, which will highlight the segment in yellow.
What are the three options available in the Segment Step Depth tool?
-The three options available are angular step, topological step, and metric step.
What does the angular step show in the segment analysis?
-The angular step shows how many road segments it takes to reach every step from the selected segment.
What is the purpose of the topological step in the analysis?
-The topological step shows the number of directional changes of streets from the chosen street to the next segment.
What does the metric step measure in the network?
-The metric step shows the pure metric value of street networks, evaluating the distance or length between segments.
Why are some areas highlighted in blue, orange, or red during the analysis?
-The colors represent the degree of connectivity and accessibility, with blue indicating well-connected areas, orange representing less connected areas, and red showing poorly connected or isolated segments.
How do you test if a specific segment is connected to the network?
-If the segment appears gray, it means it is not connected to the network.
What are the different types of radius you can include in the analysis for pedestrian and cyclist modes of transport?
-You can include a radius of 100 meters for pedestrians, 2500 meters for cyclists, 5000 meters for larger cycle networks, and 25,000 meters for round networks.
What happens when the angular segment analysis is run in the tutorial?
-The angular segment analysis evaluates the chosen segment’s connectivity to other segments, showing integration values and how well the segment is connected to the entire network, using various metrics such as pedestrian and cyclist accessibility.
Outlines

此内容仅限付费用户访问。 请升级后访问。
立即升级Mindmap

此内容仅限付费用户访问。 请升级后访问。
立即升级Keywords

此内容仅限付费用户访问。 请升级后访问。
立即升级Highlights

此内容仅限付费用户访问。 请升级后访问。
立即升级Transcripts

此内容仅限付费用户访问。 请升级后访问。
立即升级浏览更多相关视频

Topologi Ring: Cara Kerja & Kelebihannya! Jaringan Stabil. 3/25

Training a model to recognize sentiment in text (NLP Zero to Hero - Part 3)

Slope Analysis using ArcGIS Pro | With DEM Data
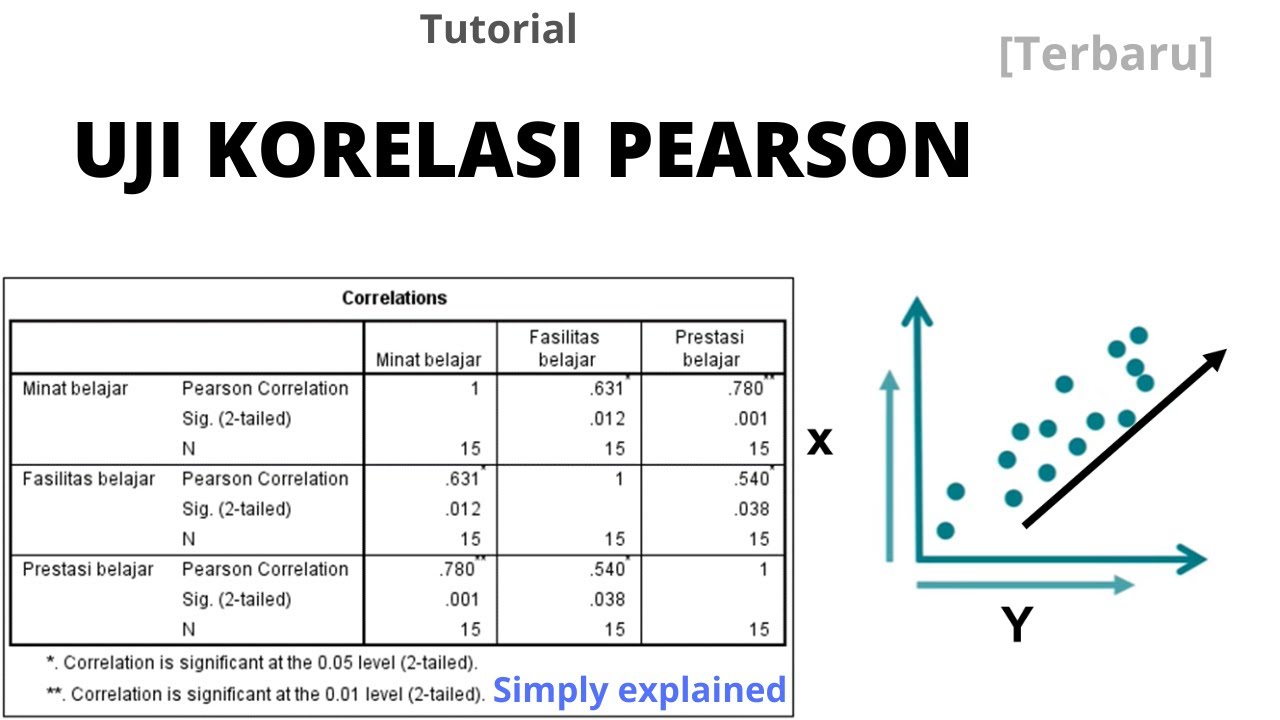
Memahami Uji Korelasi Pearson dan Cara Analisis dengan SPSS

Exploratory Data Analysis (EDA) Using Python | Python Data Analysis | Python Training | Edureka
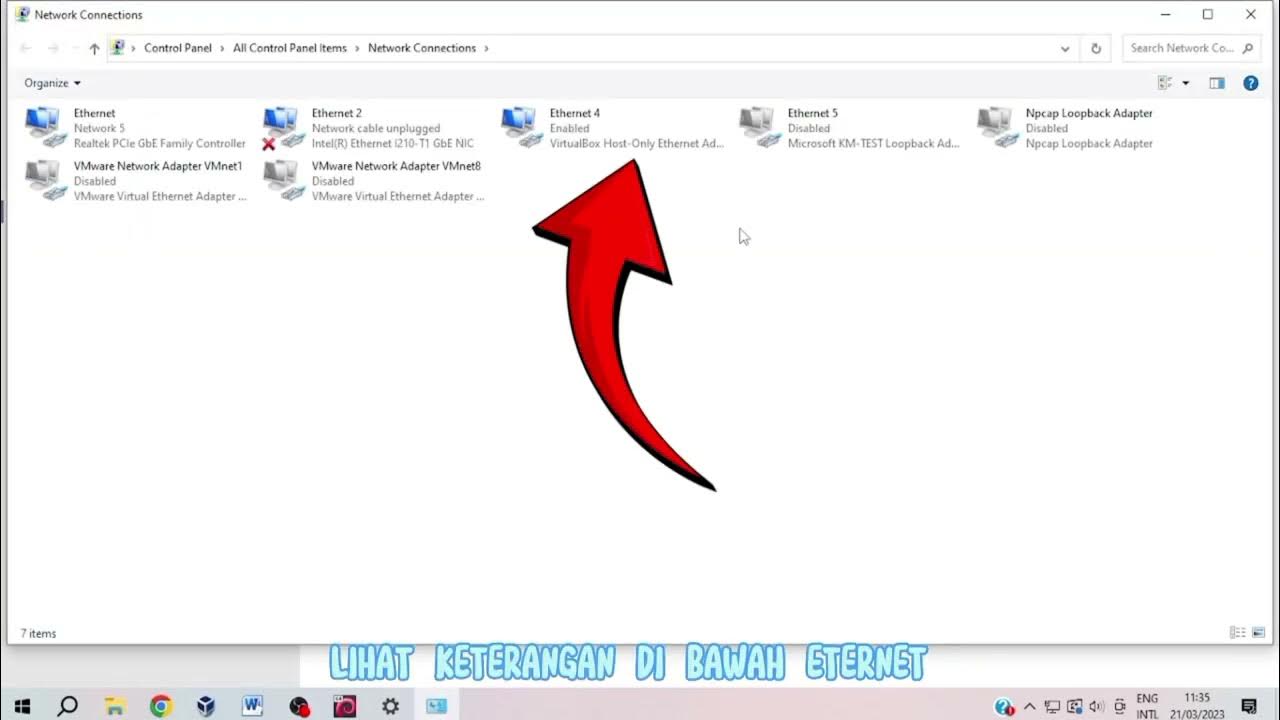
toturial cara konfigurasi TCP IP pada Linux debian dan Windows
5.0 / 5 (0 votes)
