Exploratory Data Analysis (EDA) Using Python | Python Data Analysis | Python Training | Edureka
Summary
TLDRThis tutorial walks through the process of Exploratory Data Analysis (EDA) using a small student dataset. The speaker demonstrates how to inspect, clean, and analyze data with various tools, including descriptive statistics, correlation analysis, and visualizations like histograms, box plots, and scatter plots. Emphasis is placed on understanding relationships between variables such as test scores and categorical data. The tutorial also covers data cleaning techniques, handling missing values, and preparing data for future model building. Viewers are encouraged to explore data science concepts and tools for more in-depth learning.
Takeaways
- 😀 EDA (Exploratory Data Analysis) is essential for analyzing relationships, distributions, and patterns in a dataset.
- 😀 The first step in EDA is to inspect the dataset, starting with the first and last few rows to understand its structure.
- 😀 Descriptive statistics, including count, mean, standard deviation, and min/max values, help summarize the dataset’s key attributes.
- 😀 Checking for missing data and handling it appropriately is crucial in EDA, either by dropping or filling missing values.
- 😀 Some columns may be redundant and can be removed, such as race/ethnicity and parental education level, which don't contribute significantly to the analysis.
- 😀 Correlation matrices and heatmaps are useful tools for visualizing relationships between numerical variables in a dataset.
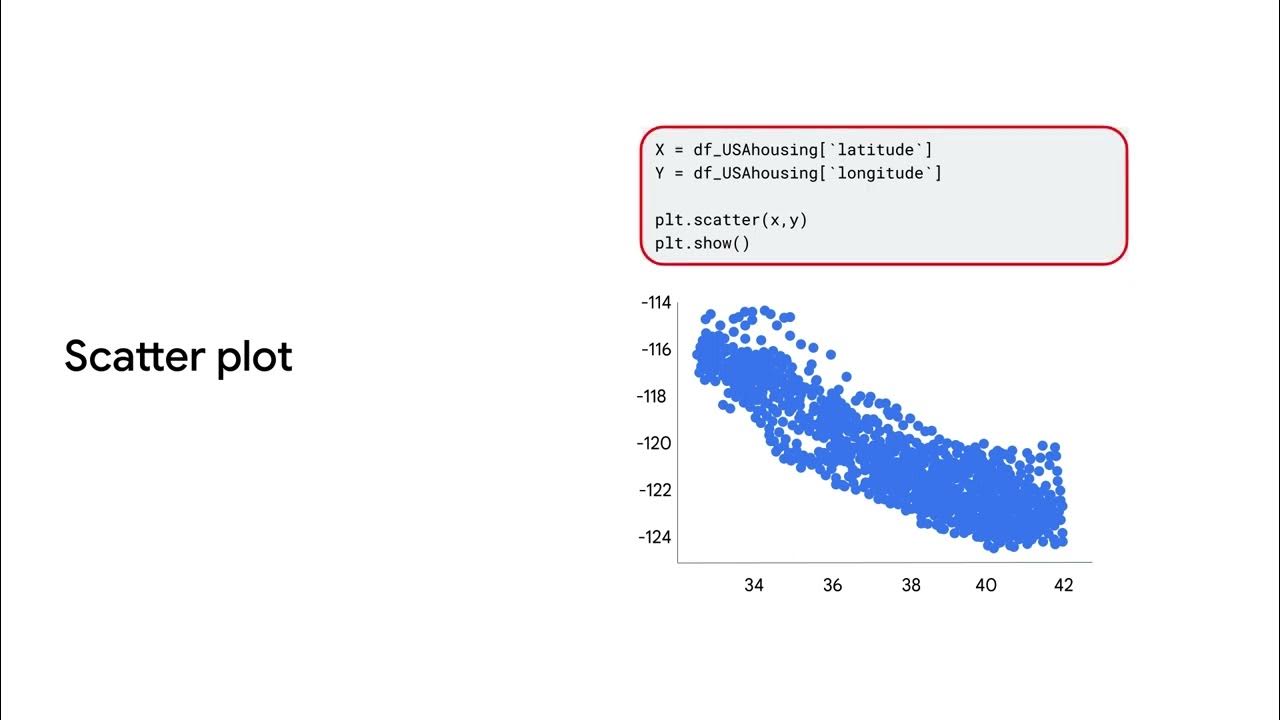
- 😀 Scatter plots are particularly effective for understanding the relationship between two continuous variables, such as test scores.
- 😀 Pair plots help visualize relationships between multiple variables at once, providing insights into how they correlate with one another.
- 😀 Histograms and box plots are helpful in understanding the distribution and spread of numerical data like test scores.
- 😀 Categorical data, such as gender or lunch, should be converted into numerical formats (e.g., 0 and 1) for machine learning model compatibility.
- 😀 After performing EDA, the next step is model building, where cleaned and processed data can be used for predictive analytics and further analysis.
Q & A
What is the primary objective of Exploratory Data Analysis (EDA)?
-The primary objective of EDA is to understand the underlying patterns, relationships, and structures in the dataset. This includes identifying data distributions, outliers, and potential correlations between different features, ultimately helping in cleaning and preprocessing the data for further analysis or model building.
How do you handle missing values in a dataset during EDA?
-Missing values can be handled in two ways: they can either be dropped (using 'dropna()') or replaced with some form of imputation. For instance, the missing values in numerical columns can be replaced with the mean, median, or mode of the column.
What role does the 'describe()' method play in EDA?
-'describe()' provides a summary of the numerical features in a dataset, such as the count, mean, standard deviation, minimum, and maximum values. It is a quick way to assess the distribution and spread of numerical columns.
Why is it important to convert categorical data into numerical values during analysis?
-Converting categorical data into numerical values is necessary for mathematical computations and machine learning models, which typically require numerical inputs. This can be done using techniques like label encoding or one-hot encoding.
What is the difference between a box plot and a histogram?
-A box plot is a graphical representation that shows the distribution of data based on the minimum, first quartile, median, third quartile, and maximum, helping identify outliers. A histogram, on the other hand, shows the frequency distribution of a dataset and helps in understanding the shape of the distribution.
What are correlation matrices and how are they useful in EDA?
-A correlation matrix is a table showing correlation coefficients between variables. It is used to identify relationships between features in a dataset. Features with high positive or negative correlations may suggest dependencies or multicollinearity, which is crucial when building predictive models.
What is the purpose of using scatter plots in EDA?
-Scatter plots are used to visualize the relationship between two continuous variables. They help in identifying trends, clusters, and potential outliers, providing valuable insights into how different variables interact with each other.
What is the significance of checking the 'shape' of a dataset?
-Checking the 'shape' of a dataset provides the number of rows and columns, which is essential for understanding the dataset's size and determining if any preprocessing or cleaning steps are necessary based on the data's structure.
Why is it important to clean redundant or irrelevant columns from the dataset?
-Cleaning redundant or irrelevant columns helps reduce the dimensionality of the dataset, improving the efficiency of analysis and models. Irrelevant data may introduce noise, leading to inaccurate predictions or conclusions.
What are the next steps after completing EDA on a dataset?
-After completing EDA, the next steps typically involve data preprocessing for machine learning, which may include encoding categorical variables, scaling numerical features, and handling any remaining issues such as outliers or imbalanced data. Once the data is prepared, it can be used for building predictive models.
Outlines

This section is available to paid users only. Please upgrade to access this part.
Upgrade NowMindmap

This section is available to paid users only. Please upgrade to access this part.
Upgrade NowKeywords

This section is available to paid users only. Please upgrade to access this part.
Upgrade NowHighlights

This section is available to paid users only. Please upgrade to access this part.
Upgrade NowTranscripts

This section is available to paid users only. Please upgrade to access this part.
Upgrade NowBrowse More Related Video

The EDA framework data hiring managers love (use it in your portfolio projects)

Understanding Your Data | Day 19 | 100 Days of Machine Learning

04-1 Memahami Data Melalui Eksplorasi Data

What is exploratory data analysis

How to Build Classification Models (Weka Tutorial #2)
Data analysis and visualization
5.0 / 5 (0 votes)