Memahami Uji Korelasi Pearson dan Cara Analisis dengan SPSS
Summary
TLDRThis tutorial provides an in-depth explanation of how to perform Pearson’s correlation test using SPSS. It covers the concept of correlation, explaining its relevance for measuring the strength and direction of relationships between two variables with normal distribution. The video demonstrates how to input data in SPSS, conduct the correlation analysis, interpret the output, and perform significance testing. The tutorial concludes with practical examples, showing how to assess the correlation strength (low, medium, high, perfect) and determine whether the correlation is significant, using real-world variables such as study interest and academic performance.
Takeaways
- 😀 The Pearson correlation test is used to measure the strength of a linear relationship between two variables with normally distributed data.
- 😀 For data to be used in Pearson's correlation, it must be interval or ratio data, such as time, temperature, height, weight, or distance.
- 😀 The Pearson correlation coefficient (r) ranges from -1 to +1, indicating the strength and direction of the relationship between variables.
- 😀 A correlation coefficient between 0 and 0.1 indicates no correlation, 0.1 to 0.3 indicates a weak correlation, 0.3 to 0.5 indicates a moderate correlation, 0.5 to 0.7 indicates a strong correlation, and 0.7 to 1 indicates a perfect correlation.
- 😀 Positive correlation means that as one variable increases, the other variable also increases (e.g., weight and shoe size).
- 😀 Negative correlation means that as one variable increases, the other decreases (e.g., product price and sales volume).
- 😀 In a sample study, the relationship between study interest, learning facilities, and learning achievement was analyzed using Pearson’s correlation.
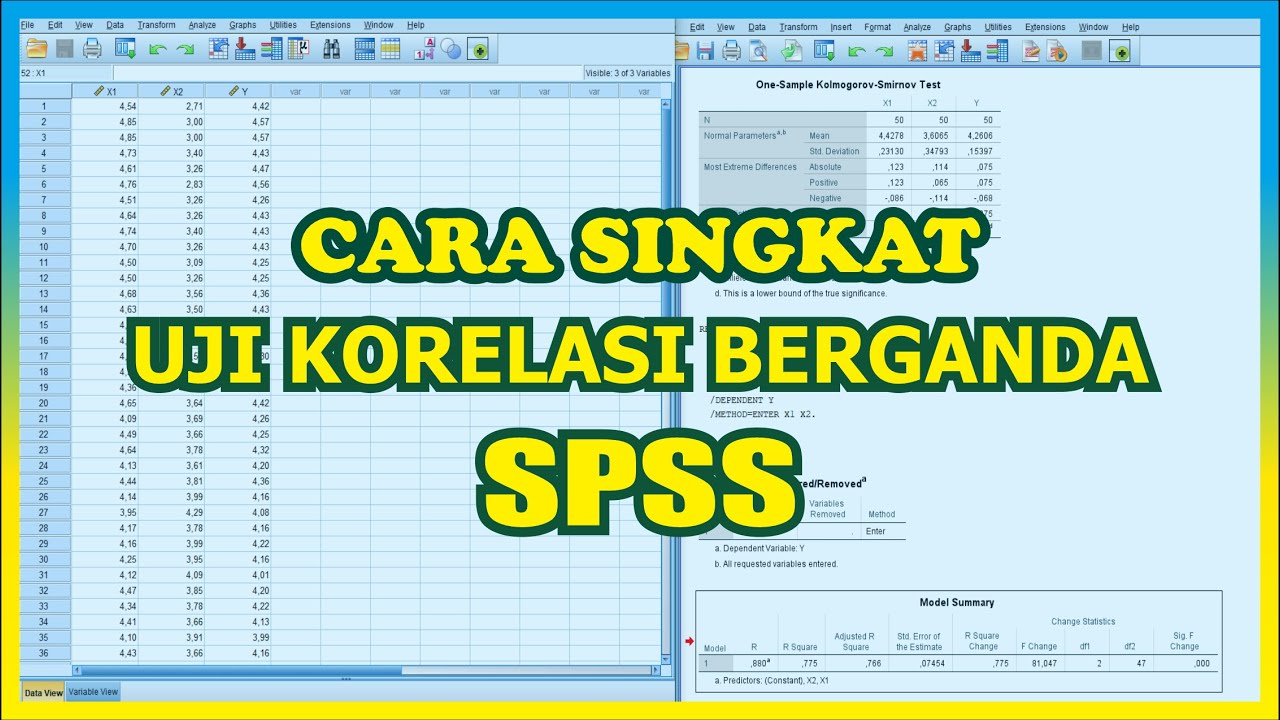
- 😀 The SPSS software is used to perform the correlation test, where variables like study interest (X1), learning facilities (X2), and learning achievement (Y) are inputted.
- 😀 The interpretation of Pearson's correlation output reveals that a correlation of 0.780 between study interest and learning achievement indicates a strong positive relationship.
- 😀 A correlation coefficient of 0.540 between learning facilities and learning achievement indicates a moderate positive correlation.
- 😀 The significance test shows that if the p-value is below 0.05, the null hypothesis (H0) is rejected, indicating a significant relationship between the variables.
- 😀 In this study, the p-values for both the correlation between study interest and learning achievement (0.001) and between learning facilities and learning achievement (0.038) are below 0.05, confirming significant relationships.
Q & A
What is Pearson's correlation test used for?
-Pearson's correlation test is used to measure the strength of the linear relationship between two variables that have a normal distribution.
What type of data is suitable for Pearson's correlation?
-The data should be interval or ratio type. Interval data includes measurements like time or temperature, while ratio data includes measurements like height, weight, or distance, which also has an absolute zero point.
How is the strength of correlation determined in Pearson's correlation?
-The strength of the correlation is measured by the correlation coefficient (R), which ranges from -1 to +1. The closer the coefficient is to 1 or -1, the stronger the correlation. A positive value indicates a positive correlation, and a negative value indicates a negative correlation.
What are the different ranges for the strength of correlation?
-The strength of correlation is classified as follows: 0 to 0.1 (no correlation), 0.1 to 0.3 (weak correlation), 0.3 to 0.5 (moderate correlation), 0.5 to 0.7 (strong correlation), and 0.7 to 1 (perfect correlation).
Can you provide an example of a positive correlation?
-An example of a positive correlation is the relationship between weight and shoe size. As weight increases, shoe size tends to increase as well.
Can you provide an example of a negative correlation?
-An example of a negative correlation is the relationship between the price of a product and its sales volume. As the price increases, sales volume tends to decrease.
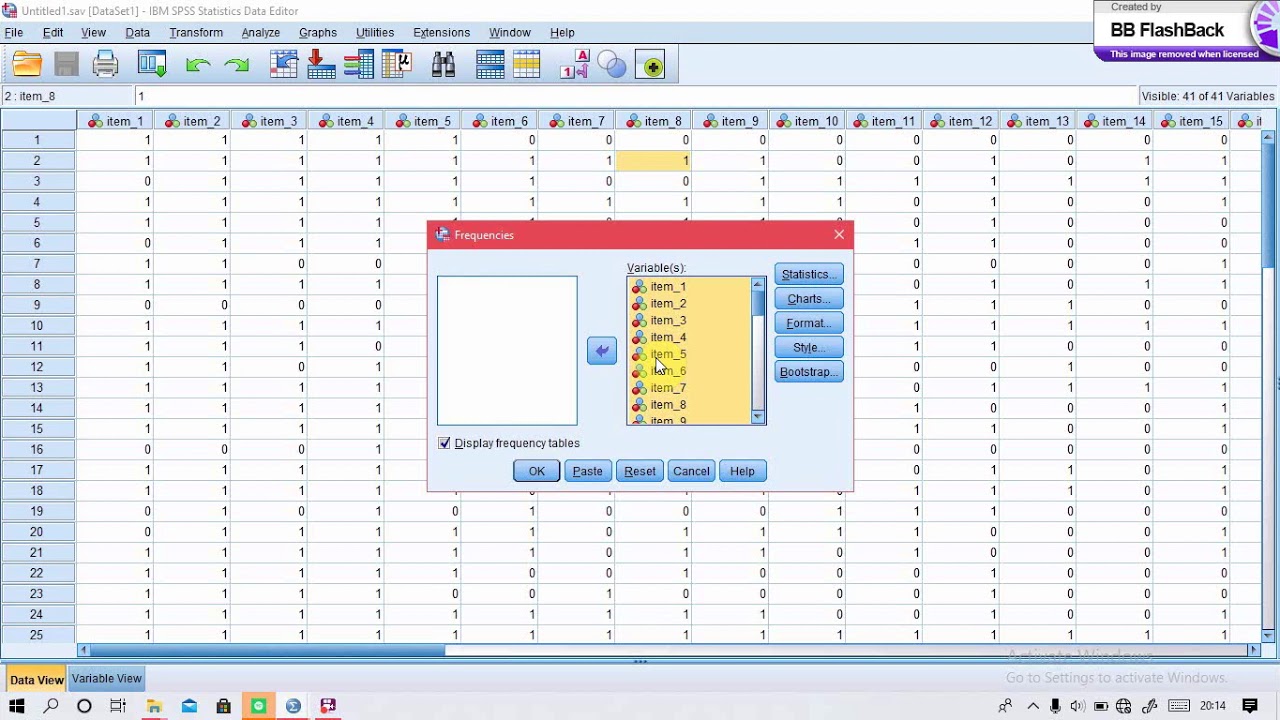
What are the steps for performing Pearson's correlation using SPSS?
-In SPSS, you go to 'Analyze', select 'Correlation', and choose 'Bivariate'. Then, you input the variables you wish to analyze. For the correlation coefficient, you select 'Pearson', check the significance box, and click 'OK'.
How do you interpret the results of Pearson's correlation in SPSS?
-To interpret the results, you check the Pearson correlation coefficient value. A positive value (e.g., 0.780) indicates a positive correlation, while the value's strength determines the closeness of the relationship. The significance value (p-value) helps to determine if the correlation is statistically significant.
How do you conduct a significance test for Pearson's correlation?
-To conduct a significance test, you compare the significance value (p-value) with the 0.05 threshold. If the p-value is less than 0.05, the null hypothesis is rejected, indicating a statistically significant relationship between the variables.
What does the significance value of 0.01 indicate in the context of Pearson's correlation?
-A significance value of 0.01 indicates that the correlation between the variables is statistically significant, meaning there is a relationship between the variables at a 99% confidence level.
Outlines

This section is available to paid users only. Please upgrade to access this part.
Upgrade NowMindmap

This section is available to paid users only. Please upgrade to access this part.
Upgrade NowKeywords

This section is available to paid users only. Please upgrade to access this part.
Upgrade NowHighlights

This section is available to paid users only. Please upgrade to access this part.
Upgrade NowTranscripts

This section is available to paid users only. Please upgrade to access this part.
Upgrade NowBrowse More Related Video
TUTORIAL SPSS : Multiple Correlation Test SPSS

[Tagalog] Pearson (r) Product Moment Correlation Coefficient - Computation and Interpretation

Cara Uji Korelasi Dengan SPSS
Menentukan Nilai Validitas dan Reliabilitas Soal Pilihan Ganda Menggunakan SPSS
validitas, reliabilitas, tingkat kesukaran dan daya pembeda menggunakan aplikasi SPSS 26.

Cara Uji Normalitas dan Homogenitas Menggunakan SPSS dengan Mudah
5.0 / 5 (0 votes)