Everything you need to know about Fair Value Gaps.
Summary
TLDRThis video script delves into the concept of Fair Value gaps in trading, distinguishing between good and bad gaps and their implications for profit. It emphasizes the importance of understanding targets, unmitigated opposing PD arrays, and the strength indicated by different types of gaps. The script guides traders on identifying the 'perfect' fair value gap for trading, suggesting case studies for practical understanding and highlighting the nuances of entry confirmation and risk management.
Takeaways
- π Fair Value Gaps can be profitable but require understanding of their types and characteristics.
- π The direction of trade is determined by the first line of defense, ideally the fair value gap at the time of retracement.
- π― Identifying the 'Target' is crucial; it's on the left side of the chart and trading occurs from the right, focusing on the most recent price action.
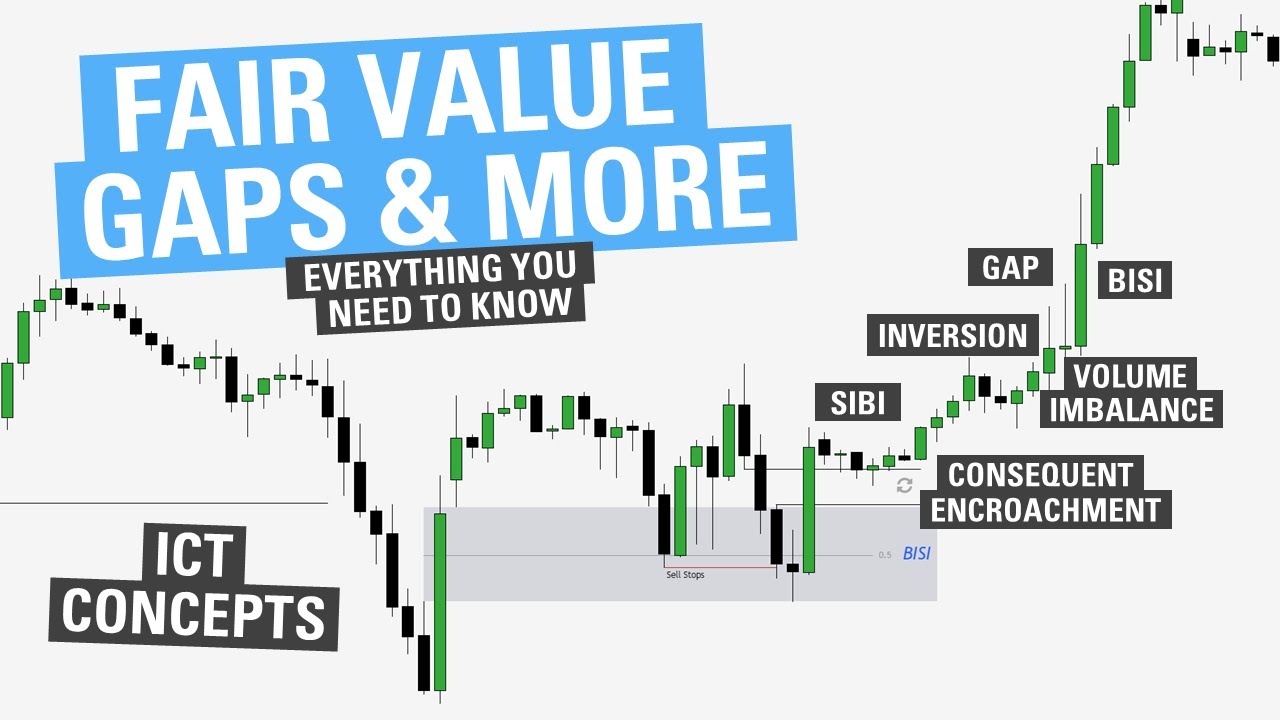
- π Fair Value Gaps are created at unmitigated opposing PD arrays, indicating areas of resistance or support that have not yet been traded into.
- πͺ Fair Value Gaps signify strength and intention in the market, showing the direction larger entities are moving the market.
- π The type of Fair Value Gap is determined by the third candle's action: a rejection, consolidation, or expansion indicates varying market strength.
- β Rejection Fair Value Gaps (RFG) show significant opposing strength and require more confirmation before trading.
- β Perfect Fair Value Gaps (PFG) display a balance of strength, indicating minimal opposing force and are ideal for trading.
- π Breakaway Gaps show strong bullish or bearish strength without a retracement, making them more challenging for entry and risk management.
- π Entry confirmation is vital, especially with RFGs, and involves looking at lower time frames for additional signals.
- π Conducting a case study on various instruments and time frames to understand which Fair Value Gaps hold and which don't is recommended for gaining experience.
Q & A
What is the main topic of the sixth video in the MMC series?
-The main topic of the sixth video in the MMC series is understanding Fair Value gaps and the different types of Fair Value gaps in trading.
What is the significance of the first line of defense in the context of the video?
-The first line of defense refers to the initial point of resistance or support when creating a retracement, ideally being the fair value gap that traders are looking to trade from.
What is meant by 'Target' in the script?
-The 'Target' in the script refers to a specific price level on the left side of the chart that traders aim to reach, using the most recent price action and fair value gaps on the right side for trading decisions.
How are fair value gaps created according to the video?
-Fair value gaps are created at unmitigated opposing PD arrays, which are areas of price resistance or support that have not been traded into before.
What does 'unmitigated' mean in the context of fair value gaps?
-'Unmitigated' means that the price level has not been traded into or tested by the market since the fair value gap was created.
What is the difference between a good and bad fair value gap?
-A good fair value gap is one that shows strength and intention from larger market entities, while a bad fair value gap may indicate a lack of strength or a false signal that could lead to a loss in trading.
What is an 'expansion phase candle' in the context of fair value gaps?
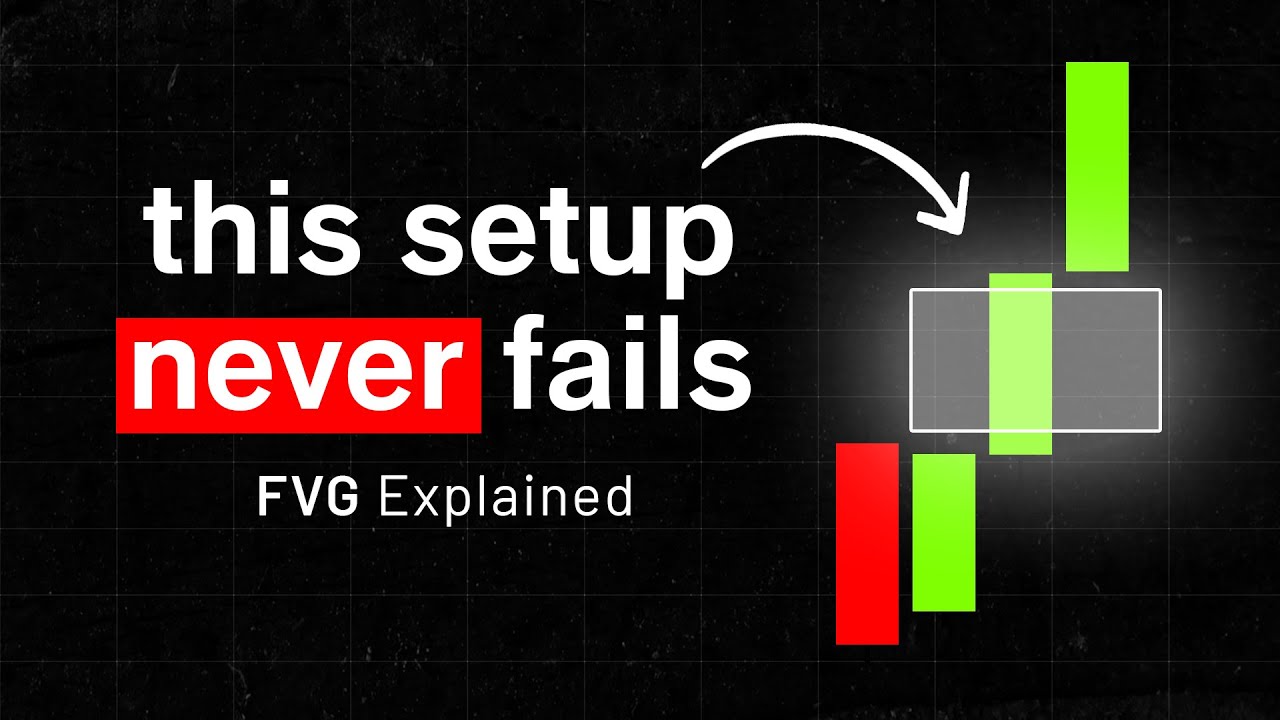
-An 'expansion phase candle' is the second candle in a fair value gap formation that closes above the high of the first candle, creating the potential for a fair value gap.
What are the three types of third candles that determine the quality of a fair value gap?
-The three types of third candles are the rejection third candle, the consolidation third candle, and the expansion third candle, each showing different levels of market strength and intention.
Why are rejection fair value gaps (RFGs) considered the worst to trade from?
-Rejection fair value gaps (RFGs) are considered the worst to trade from because they show too much bearish strength after the creation of a fair value gap, indicating a high probability of the market continuing in the opposite direction.
What is a 'perfect fair value gap' (PFG) and why is it considered the best to trade from?
-A 'perfect fair value gap' (PFG) is a fair value gap with a consolidation third candle, showing a balance between bullish and bearish strength, making it the best to trade from as it indicates a high probability of the market continuing in the intended direction.
What is a 'breakaway gap' and how is it different from other fair value gaps?
-A 'breakaway gap' is a type of fair value gap characterized by an expansion third candle, showing strong bullish or bearish strength without a retracement. It is different because it often occurs when the market has not yet reached a significant resistance or support level (PD array), suggesting further price movement before a retracement.
Why is it recommended to do a case study on fair value gaps?
-A case study on fair value gaps is recommended to gain a deeper understanding of which gaps hold and which do not, and to practice identifying and labeling different types of fair value gaps in various market conditions.
Outlines
π Understanding Fair Value Gaps for Trading
This paragraph introduces the concept of Fair Value gaps and their significance in trading for profit. It distinguishes between good and bad Fair Value gaps, emphasizing the need to identify them correctly. The paragraph also explains the importance of the first line of defense, the ideal fair value Gap, and the concept of unmitigated opposing PD arrays. It uses the example of Canadian dollar JPY to illustrate trading towards a target using the most recent fair value Gap and order flow lag.
π Identifying Targets and Fair Value Gaps
The second paragraph delves into the specifics of identifying targets and fair value gaps. It explains that targets are on the left side of the chart and trading occurs from the right, using the most recent price action. The paragraph further clarifies how fair value gaps are created at unmitigated opposing PD arrays, which are resistance areas that can lead to rejection and the formation of new fair value gaps. It also discusses the importance of understanding the strength and intention behind market movements by larger entities, as indicated by fair value gaps.
π The Anatomy of Fair Value Gaps
This paragraph breaks down the anatomy of fair value gaps, explaining the three types of third candles that can form after an expansion phase candle. It describes the rejection third candle (RFG), which shows too much opposing strength, the consolidation third candle, which is a sign of a balanced fair value gap, and the expansion third candle, which indicates strong bullish or bearish strength. The paragraph uses examples to illustrate how these gaps can affect trading decisions and the importance of entry confirmations.
π« Avoiding Rejection Fair Value Gaps
The fourth paragraph warns against trading from rejection fair value gaps (RFGs), which show significant bearish strength and can lead to continued lower prices. It advises seeking more confirmation before trading from these gaps and uses the gold chart as an example to illustrate the concept. The paragraph also discusses the importance of understanding the difference between a rejection and a perfect fair value gap, especially when considering entry points and risk management.
π Capitalizing on Perfect and Breakaway Gaps
The final paragraph discusses how to capitalize on perfect fair value gaps (PFGs) and breakaway gaps. It describes PFGs as the best to trade from, showing little to no opposing strength and offering a good balance for continuation of the trend. Breakaway gaps, on the other hand, require more experience to trade effectively and should be approached with caution. The paragraph suggests studying which fair value gaps hold and which do not through a case study, using a tool provided in the description for analysis.
Mindmap
Keywords
π‘Fair Value Gap
π‘Target
π‘Orderflow Lag
π‘Unmitigated
π‘PD Arrays
π‘Expansion Phase Candle
π‘Rejection
π‘Consolidation
π‘Breakaway Gap
π‘Entry Confirmation
Highlights
Fair Value gaps can be profitable but require understanding the difference between good and bad gaps.
The importance of identifying the target on the left side of the chart when trading from a fair value gap on the right.
Fair Value gaps are created at unmitigated opposing PD arrays, indicating areas of resistance or support.
Unmitigated means the price has not traded into the area before, maintaining its strength as a resistance or support level.
Opposing PD arrays are significant in identifying where fair value gaps are likely to form and act as resistance.
A fair value gap signifies the strength and intention of larger market entities moving the price.
The three types of fair value gaps are identified by the third candle's action: rejection, consolidation, or expansion.
A rejection third candle shows a large down candle, indicating bearish strength and a potential poor fair value gap to trade from.
A consolidation third candle represents a balanced fair value gap, showing little bearish strength and a good opportunity to trade.
An expansion third candle, or breakaway gap, shows strong bullish strength but may be difficult for entry and risk management.
The significance of respecting unmitigated opposing PD arrays when trading from a fair value gap.
How to identify and trade from perfect fair value gaps (PFG) which show minimal opposing strength and are ideal for trading.
The potential for a breakaway gap to continue the trend before reaching a significant PD array or target.
The importance of trading breakaway gaps with caution and gathering experience with other types of fair value gaps first.
The recommendation to conduct a case study on various instruments and time frames to understand which fair value gaps hold and which do not.
The use of study notation to label and analyze fair value gaps in practice, enhancing understanding of their behavior.
The emphasis on the universal applicability of fair value gap analysis across all time frames from minute to yearly.
Transcripts
Now Fair Value gaps can bring you a lot
of profit but you need to understand
that not every fair value Gap is the
same you have good fair value gaps and
bad fair value gaps and that's exactly
what we are going to go over in the
sixth video of the MMC series we're
going to touch on Fair Value gaps and
the different fair value gaps that we
also have in the first slide I want to
revisit the previous video that we had
about narrative where we touched on the
first line of defense so the first PD
rate that we run into when we create a
retracement is ideally the fair value
Gap that we have sitting right there
this is focusing on that we already have
the direction that we are now looking at
a fair value Gap to trade from and we
know based on the previous video as well
that ideally we want to see the flot
being a fair value Gap but within that
we still have different types of fair
value gaps so moving on we start off
with a Target if we want to understand
if we are trading from a good fair value
Gap then we first of all need to
understand what the target is so what do
I mean by that the target is going to be
on the left side and we trade from the
right what do I mean by that well if we
take a look at this example right here
then we see we have a Target on the left
side that Target is not within the
current orderflow lag that we are
trading and if we are looking to trade
towards that Target we are going to use
a fair value Gap sitting right there on
the right side in the most recent price
action so we're always talking about the
most recent orderflow lag and the most
recent fair value gaps as well so to
show you an example here on Canadian
dollar JPY on The Daily time frame we
have this fair value Gap right there
that we are looking to trade from and we
have a Target towards the left right
there in the form of those swing points
and those Sur Val gaps that we talked
about in earlier videos that is towards
the left because that is going to be our
Target so whenever I refer to the right
side of the chart I always refer to the
most recent order flow lack all right so
once we have that Target on our chart we
also need to understand where do fair
value gaps actually get created fair
value gaps get created at
unmitigated opposing PD arrays now what
does that mean here in this example we
have a lot of candles and at the top
right there we have that swing High
let's say the previous price action was
point so we had bullish price action and
we could argue that we want to trade
into that swing high right there so that
is our main target on the way to that
Target we will encounter unmitigated
opposing PD Ray what is that first of
all unmitigated stands for it has not
been traded into before so for example
on Canadian dollar JPY this fair value
Gap is now mitigated it is not
unmitigated anymore because we have
traded into it right there but this fair
value gap for example is unmitigated
since there was no price action there
was no trading inside that fair value
Gap but this fair value gap for example
is unmitigated because after the fair
value Gap was created we did not trade
back into it just yet this can also be
said about swing highs or swing lows so
for example this swing High has been
traded back above now it's mitigated but
this swing high right here is
unmitigated this is extremely important
to understand otherwise you're going to
lose a lot of accuracy and we're not
going to be on the same page anymore so
for example this fair value right here
is unmitigated as we continue higher but
as soon as we come down and with that
first candle right there the smallest
price movements inside this fair value
Gap that has been created now it is
mitigated so we don't use it anymore now
that's the unmitigated part then we move
on to opposing PD Rays what are opposing
PD Rays well if we continue higher and
we are bullish discount arrays are going
to be holding we have discount arrays as
order flow lags so if the trend is
bullish and discount arrays are holding
that means premium arrays are the
opposing PD arrays so in this example we
have this fair value Gap sitting right
there which is an unmitigated opposing
PD rate if we want to continue higher
also known as resistance this fair value
Gap is going to resist us from reaching
that Target right there so when we trade
back into that right there since it is
resistance we can expect some kind of
rejection now whether the rejection is
very big or very small that's what
determines what type of fair value Gap
it's going to be but at those
unmitigated opposing PD Rays that's
where we create new fair value gaps now
we have another unmitigated opposing PD
and that is this swing high sitting
right there so when we trade into that
that is exactly where we can expect a
rejection that resistance area creates a
rejection and that rejection creates a
new fair value Gap right there that we
can continue higher off of so if we
again take a look at Canadian dollar JPY
we have this as our main target this
intermediate term low on the way there
we will see that we have a few
unmitigated opposing PD rays in the form
of this swing low for example when we
continue lower create this expansion
phase candle the second candle of the
fair value Gap the third candle stinks
into that the fair value Gap gets
created at that unmitigated opposing PD
Ray that resistance area then causes a
rejection and that caus the retracement
to sting back into the F Val Gap to then
continue lower now that's quite a lot
going on we're going to break that down
fully so you can easily understand it so
the important part is to understand
unmitigated opposing PD rat that they
act as resistance for Price action when
we run into that resistance that can
create a rejection which can create a
fair value Gap to then continue higher
or continue lower that is where fair
value gaps get created now first we need
to understand the basics of a fair fair
value Gap a fair value Gap is a sign of
strength and intention when I mention
strength or intention I mean the same
exact thing there are bigger entities
trading the markets that we also trade
with a lot of lots with a lot of money
on the line they can move the market so
when they move the market they can't
simply hide that and what happens when
they move the market they create fair
value gaps so they show the intention of
what price actually wants to do they
show the strength now there's three
options and each three show different
types of strength first of all what
we're seeing on the left right here is
two candles so we need one more candle
the first candle of any fair value Gap
can either be a down candle an up candle
consolidation doesn't really matter the
second candle if we are talking about a
bullish fair value Gap is an expansion
phase candle an expansion phase candle
means that it closes above the previous
candle high right there so above the
first candle high and since it closes
above the first candle High it creates
the future potential fair value Gap in
the form of this area right here so this
whole gray box is where we can
potentially see a fair value Gap then
the second candle that candle is called
the expansion phase candle and now
depending on what the third candle will
do that will determine what type of fair
value Gap we have a good fair value Gap
or a bad fair value Gap the first option
is the following a rejection third
candle now what does a rejection third
candle looks like well first of all
where does a fair value Gap again
potentially get created that unmitigated
opposing PD right there like we're
seeing in the example now that
unmitigated opposing PD is also a
previous Target of course because we're
always moving towards those PD Rays so
once we reach that Target we want to be
a little bit more careful and see what
we want to do right there because the
third candle of this new fair value Gap
that could be created could be a
rejection third candle like we're seeing
right here now why is this a rejection
third candle because we saw how big the
fair value Gap could potentially be with
the gray box that we just saw now we
take away all that potential fair value
Gap and we create a large down candle
actually rejecting lower now what is the
thought process behind this well if we
want to continue higher right here then
we should have quite a lot of bullish
strength right and if that fair value
Gap was supposed to be quite big but all
of a sudden now turns into a very small
fair value Gap that tells us that
there's also quite a lot of bearish
strength in the market and this is not
good now we'll go more in depth on this
later on then the second type of fair
value Gap that we can have is the
consolidation third candle where the
third candle is a consolidation right
there this is the perfect fair value Gap
then the third type of fair value Gap
that we can have is an expansion third
candle so when we were talking about the
second candle of a fair value Gap always
being an expansion phase that same exact
thing happens but now on the third
candle again these three options show
different types of strength where this
one shows a lot of bullish strength the
consolidation shows still a lot of
bullish strength because we have created
a fair value Gap but just enough bearish
strength to create a consolidation and
to create a retracement the rejection
third candle shows too much strength to
the opposing side and of course when we
are looking for bullish prices we don't
want the bearish S to be extremely
strong because that can lead to either
consolidation or can lead to lower
prices which of course if we want higher
prices not something we want to see so
let's dive into these different third
candles right there these different type
of fair value gaps where the first one
is again the rejection third candle now
just for Simplicity sake and just so we
know what we're talking about I've named
it an rfg rejection fair value Gap now
when we see this three candle pattern we
want to of course go over have we ran
into one of those unmitigated opposing
PD Rays because if we did then we can
also see that we are actually respecting
that opposing PD
which tells us that there is some
bearish strength in the market now this
is the worst FG to trade from shows too
much bearish strength and of course we
can just simply inverse it if we're
talking about a bearish fa Gap and
there's too much bullish strength like
we mentioned usually comes from an
unmitigated opposing PD Ray when we have
an rfg like this we want to make sure
that we require more confirmation so for
example if this is a daily fair value
Gap and we want to go into the 15minute
time frame eventually for our entry
confirmation then we want more
confirmation than usual because this is
a sign that we might just actually
continue lower instead of continuing
higher even though there's a fair value
Gap right there because something like
this might just happen where we actually
create a new down candle and we just
simply continue lower disrespecting the
bullish fair value Gap now there is a
lot of beautiful examples right right
here on the gold chart then if we pay
attention to those unmitigated opposing
pays here we have this swing high right
there this is something when you start
paying attention to it it will happen
extremely often when we reach a high
like that and we are respecting that
high right there based on candle science
that means that we are potentially
sweeping that high because we are
wicking it when we have a sweep like
this coming back into to a fair value
Gap right there that is not the ideal
scenario that makes this daily for Value
Gap already lower probability to trade
from because when we have a sweep like
that we can actually look to continue
lower instead so the bullish fair value
Gap doesn't have a lot of significance
anymore it has more significance before
we reach that
high so since we are respecting that
high we can expect a lot of bearish
strength in the market as well so as a
general rule thumb fair value gaps that
are being traded back into when coming
off a sweep like this those are not good
fair value gaps they can hold but you
would want to see more confirmation
because the retracement into the fair
value Gap tends to be a little bit
deeper than normal now if we then
continue lower and we understand that
this is also a bigger fair value area
right so if we're not offering fair
value anymore we could potentially be
seeking liquidity so these lows right
here the low of this bigger fair value
area could be the Target on the way
towards that low we will see that we
have this fair value Gap right here
which also creates this fair value Gap
that we sting back into now here we
don't have a big rejection higher I
would argue but if we take a look at
this scenario where we have this fair
value Gap sitting right here look at the
difference in the rejection from this
fair value Gap back to this fair value
Gap and from this fair value Gap back to
this fair value Gap right here we could
have created a full fair value Gap like
this right here this big but only about
what is it not even 25% of the potential
fair value Gap is actually created right
there creating an extremely big
rejection higher since the rejection is
so big there's a lot of bullish strength
in the market as well so we can actually
expect a deep retracement or even higher
prices this is not a good fair value Gap
to trade off of right there and if we do
want to continue lower we would want to
see more confirmation now what more
confirmation is is something that will
dive deeper into when we get to entry
confirmations these are fgs is the ones
we want to watch out for where the
rejection is very big because these are
the worst fair value gaps to trade from
now moving on to a better fair value Gap
is the consolidation third candle I just
labeled this one as the PFG the perfect
fair value Gap it all starts again with
that PDR that we have towards the left
right there now we could argue we are
still respecting that because we are
wicking it but the rejection in the
third candle right there is not as big
to continue lower this means the
following this is the best FG to trade
from it shows little to no bearish
strength and of course if we inverse it
again shows little to no bullish
strength
when we have a fair value Gap like this
this means that we have a perfect fair
value Gap we see that the potential of
the fair value Gap was large the
expansion phase candle that second
candle and also it created a very big
fair value Gap this shows that in that
third candle there was enough bearish
strength to create a retracement into
the fair value Gap like we see right
there but not enough bearish strength to
create a full rejection so if it helps
we could put this into a percentage here
we could argue we are 80% with the
bullish strength 20% with the bearish
strength where we still create a
retracement enough of a retracement to
sting into the value Gap to then
continue higher whereas in with the
rejection fair value Gap we are more
like 60% bullish and maybe 40% bearish
and that's why we create such a big
rejection now the closer the bullish and
the bearish percentages are to each
other so if they are 50/50 that of
course means that we have a
consolidation so we want to find the
perfect balance in that so on Canadian
dollar JPY we see right here we have
this as our main target like we already
discuss the fair value gets created
based off a rejection that we have right
here at that swing low we could make the
argument that this is somewhat of a big
rejection so if we go down time frames
into the four our time frame then we
could wait for another fair value Gap to
continue lower instead more confirmation
now what do we see right here we get
this fair value Gap right there does not
necessarily get created at the opposing
PD ra right there but we have a perfect
third candle consolidation right there
which means we can sting into it to then
simply continue lower but if we now
confirm this again into the 1 hour then
we see off of the 4H hour fair value Gap
we also create
this 1H hour fair value Gap right there
at a previous unmitigated opposing PD
Ray which causes the retracement the
third candle being a consolidation which
we can then perfectly fine continue
lower from these fair value gaps are the
perfect fair value gaps hence the name
PF now after the PFG we have one more
type of fair value gap which we have to
understand because these are also very
common and that is the expansion third
candle also known as a breakaway Gap the
back right there now with the Breakaway
Gap right here there's a difference with
the previous two examples that we have
for the perfect fair value Gap and the
rejection fair value gap on where we
want that opposing unmitigated pdate to
be because here ideally we don't want to
see that we have reached that Target
just yet now we'll dive into why this is
not the worst and not the best fair
value G to trade from it shows a lot of
bullish strength so if we're talking
about that strength this could be 100%
bullish strength but is a 100% bullish
strength always what we want we could
argue and logically speaking yes of
course we want that but when there's too
much strength on one side and we
actually don't create a retracement then
it makes it more difficult for entry and
for the risk management so yes it's good
to still trade off of it but it makes it
a little more difficult because now you
deal with a lot of different variables
as well how far can we retrace what is a
good fair value up on the lower time
frame where can we place our stop- loss
there's a lot more going into it whereas
in the perfect fair value Gap is a lot
easier a lot simpler to trade off of now
when we talk about this Breakaway Gap we
want to do the following we want to make
sure that we only trade it if the
unmitigated opposing PD has not been
reached just yet why is that because
then it it still has room to continue
higher whereas if we reach that PD Ray
right there then like we saw with the
perfect Val Gap or the rejection fair
value Gap we can create a bigger
rejection we can create that fair value
Gap to then continue higher so we can
actually expect price to reject a little
bit but if we have not reached a PD rate
just yet we can expect price to still
continue higher a little bit before we
create any rejection now we can
capitalize on it through the following
we can go down time frames and find a
new fair value Gap to capitalize on the
understanding that the next candle will
most likely reach that PD Ray very
similar to what we went over in Candle
signs we understand the next candle is
most likely going to be a bullish candle
until we reach that PDR so if on one
time frame that's a singular candle we
can go down time frames to find the
order flow lag that will take us there
and then essentially it's the same
thought process because then again we
look it's a rejection Sur Gap is it a
perfect Sur Gap or a breakway gap now
this will look something like the
following where the next candle is just
a bullish up candle right there
continuing the trend now if we take a
look at US Dollar Canadian Dollar on The
Daily time frame here we see that we
have this as our main target the highest
swing point then before we reach that we
actually have this swing point and this
swing Point as well that will act as
that resistance those unmitigated PD
Rays now the important part that we see
as well if we compare compare it to
those perfect fair value gaps and also
those rejection fair value gaps we do
not create a rejection of those previous
resistance areas now with that
understanding and understanding that we
can still continue higher towards this
swing high right there whilst not
creating a rejection that indicates that
these right here are actually Breakaway
gaps where most likely we can already
deliver higher towards the Target that
we have right there before we create a
bigger retracement so if we go down time
frames and we look at this area before
we reach the highest swing point right
there then we will see on the 1 hour
right here we run into this resistance
area this resistance area actually gives
quite a big rejection I would argue on
the 1 hour but afterwards it creates a
new fair value Gap right here a new
order flow lack to continue higher from
and this is then a fair value Gap that
we can again simply trade off of to then
continue higher and afterwards we create
even new F gaps right there and a small
F Gap sitting right there which we can
look to continue higher from to
eventually reach the main target that we
had right there that is how we can
capitalize on a breakaway Gap now
capitalizing on Breakaway gaps is a
little bit more difficult requires in my
opinion a little bit more experience as
well so if you're just starting out and
focusing on Fair Value gaps then just
focus on the perfect fair value Gap
because this again again is the best fvg
to trade from and I want to emphasize on
the fact on any given time frame so from
the one minute to the yearly time frame
it does not matter this is the easiest
fair value Gap to capitalize on
especially when you're just starting out
breakway gaps are just a little more
difficult so first gather experience
with fair value gaps then eventually you
can look into Breakaway gaps as well the
rejection fair value gaps that we have
you can simply avoid so only focusing
right now on these perfect fair value
gaps as our first line of defense this
is then what we can trade from
eventually and where we can use our
entry confirmation now I highly
recommend doing a case study because
you'll never truly understand Concepts
if you don't do a case study so the case
study for this video is study which Fair
Val gaps hold and which ones don't and
then label them so what I mean by that
go into any instrument let's say the
dollar right here go into any time frame
so let's pick the 15 minute simply Mark
out all the fair value gaps that we had
in recent price action right there then
see off of which fair value gaps we
actually followed through meaning we
actually continued lower and created new
fair value gaps right there see where
they get created as well and then start
labeling them so is it a rejection fair
value Gap is it a perfect fair value gap
or is is it a breakway gap you can again
use the study notion that I made
completely for free it's in the link in
the description all right perfect thank
you
5.0 / 5 (0 votes)