100+ Statistics Concepts You Should Know

Very Normal
31 Jul 202313:46

Summary

TLDRThis video introduces statistics as a means to control information and make sense of randomness in data. It covers key statistical concepts like types of data, probability distributions, measures of central tendency and variation, hypothesis testing, sampling distributions, confidence intervals, regression modeling, experimental design, parametric vs nonparametric models, prediction, machine learning models, causal inference, counterfactuals, robust statistics, and recommendations for learning statistics like R programming and simulation.

Takeaways

  • 😀 Statistics helps us analyze data and make sense of randomness and uncertainty
  • 📊 There are two main types of data: quantitative (numbers) and qualitative (words)
  • 🎲 Probability theory describes the inherent randomness in data
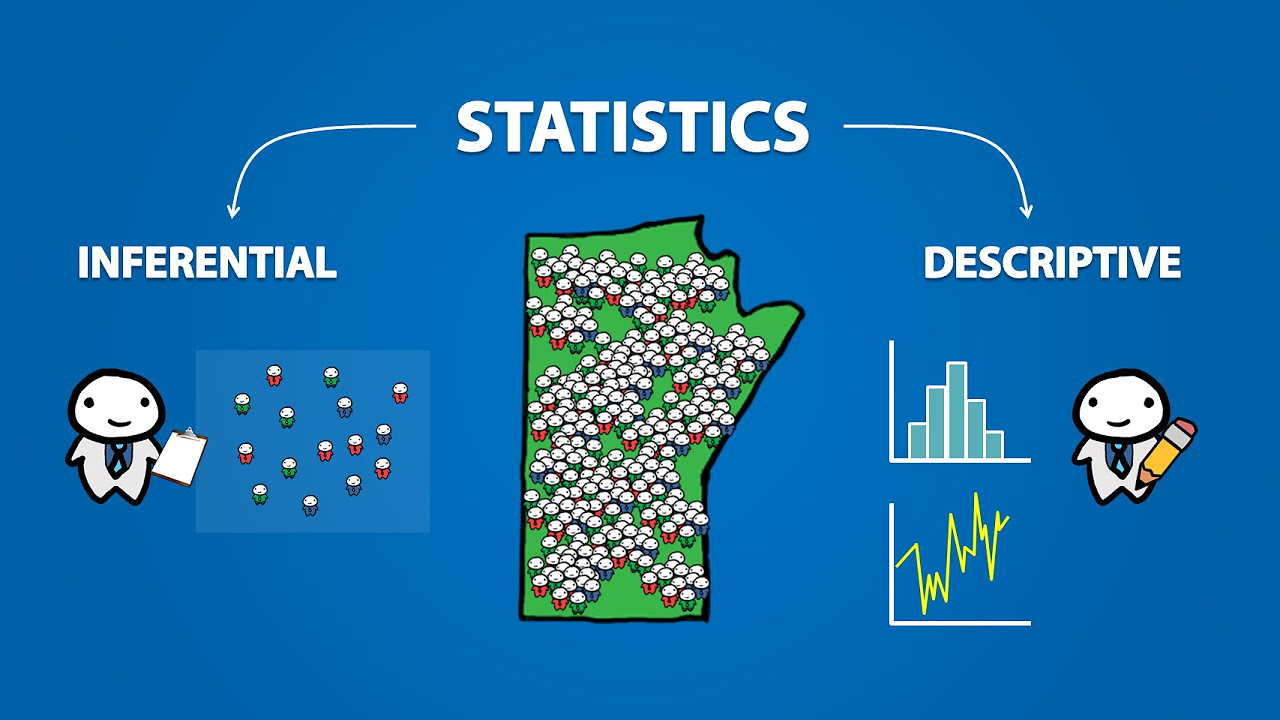
  • 📈 Descriptive statistics summarize and describe the properties of data
  • 🌡️ Inferential statistics allow us to make conclusions about populations from samples
  • 🧪 Experiment design and data collection methods impact the conclusions we can draw
  • 😯 Machine learning uses statistics to make predictions from data
  • 🤯 Modern statistics tackles very complex, high-dimensional data analysis problems
  • 📐 Assumptions are crucial in statistics - models can fail if assumptions are violated
  • 👩‍💻 Statistical programming languages like R help analyze data and test models

Q & A

  • What is the main purpose of statistics?

    -The main purpose of statistics is to make sense of data and information despite the presence of randomness. It aims to uncover patterns, relationships, and insights from data.

  • What are the two main types of data?

    -The two main types of data are quantitative data (numerical data) and qualitative data (categorical or text data).

  • What is a random variable and what does its probability distribution describe?

    -A random variable is a variable that can take on different values probabilistically. Its probability distribution describes the probabilities associated with each potential value.

  • What is the difference between descriptive and inferential statistics?

    -Descriptive statistics summarize and describe the actual data collected, while inferential statistics make inferences about an unobservable larger population based on a sample of data.

  • What is the purpose of hypothesis testing?

    -Hypothesis testing is used to make decisions about hypotheses/claims made about a population. It allows us to conclude whether we have enough evidence to reject the initial hypothesis.

  • What are Type I and Type II errors in hypothesis testing?

    -Type I error occurs when we reject a true null hypothesis. Type II error occurs when we fail to reject a false null hypothesis.

  • What is the difference between observational and experimental studies?

    -Experimental studies involve randomization and manipulation of conditions, allowing causality conclusions. Observational studies do not involve manipulation, only observation.

  • What is semi-parametric modeling?

    -Semi-parametric modeling involves using both parametric components (with a finite number of parameters) and non-parametric components (without a predefined structure) in a model.

  • Why is programming important for statisticians?

    -Programming allows statisticians to implement statistical techniques, analyze data, run simulations to test models, automate tasks, and more effectively work with data.

  • What advice is offered to those wanting to get started with statistics?

    -The video advises learning a statistical programming language like R, running simulations to test models, and recognizing that building statistical skills requires hard work over time.

Outlines

00:00

😊 Overview of data types and role of statistics

This paragraph provides an introduction to different types of data like quantitative, qualitative, discrete, continuous, binary, count, time-to-event, etc. It also introduces key concepts like randomness, probability theory, random variables, probability distributions that are commonly used in statistics to make sense of data and draw insights from it.

05:00

😀 Random variables, conditional probability and statistical modeling

This paragraph discusses additional probability concepts like conditional probability, independence of random variables, Bayes' theorem. It then explains core ideas in statistics - defining a population, drawing a sample from it, making assumptions/models about data generation, using sample to estimate unknown population parameters, distinction between descriptive and inferential statistics.

10:01

📈 Hypothesis testing, errors, test types and experimental design

This paragraph provides an overview of hypothesis testing, null and alternate hypotheses, p-values, confidence intervals, type 1 and type 2 errors, setting significance levels, different types of tests like one sample, two sample, ANOVA, chi-square for different data types and study designs. It emphasizes the importance of experimental design in causal inference.

Mindmap

Keywords

💡data

Data refers to quantitative information that is observed and collected, acting as the raw material for statistical analysis. As stated in the video, "In the beginning there was Data" - data provides the foundation for statistics. Different types of data include quantitative (numerical) and qualitative (categorical) data. Examples of data from the script include clinical biomarkers, age, and binary (0/1) data.

💡random variable

A random variable is a key concept used to represent data statistically. It can take on different values with different probabilities. As stated, random variables "have special functions that describe the probabilities associated with each value". Common examples are continuous or discrete random variables. Random variables are important for modeling randomness and variation in data.

💡probability distribution

The probability distribution of a random variable describes the probabilities associated with different values it can take. It captures the structure behind the randomness in data. Examples given include the normal, binomial and Poisson distributions. The shape of the distribution, described by the probability density function, allows statisticians to model and understand variation in data.

💡estimator

An estimator is a statistic used to estimate an unknown population parameter. As samples are collected from a population, estimators construct a best guess for parameters of interest. The sample mean is a commonly used estimator to infer information about the population mean. Estimators allow statisticians to make inferences about unobserved populations.

💡hypothesis test

Hypothesis tests are procedures used to make decisions about population parameters based on sample data. They involve stating a null hypothesis and an alternative hypothesis. Based on the data, statisticians determine whether to reject the null in favor of the alternative or not. Examples in the video include one sample, two sample and ANOVA hypothesis tests.

💡p-value

The p-value is the probability of obtaining sample results at least as extreme as observed, assuming the null hypothesis is true. Small p-values suggest the null is unlikely and provide evidence to reject it in favor of the alternative hypothesis. P-values are central to most hypothesis testing procedures.

💡statistical model

A statistical model is an mathematical representation used to describe and understand the data generation process. Models make assumptions about the mechanisms behind the data. Examples given include regression models, generalized linear models, longitudinal models and more. Appropriate modeling is crucial for valid statistical inference.

💡experimental design

Experimental design refers to how data collection is planned and structured. Elements of design like randomization of treatment groups allow causal interpretations. The video emphasizes that understanding the experimental design is vital for knowing what conclusions can validly be drawn from data.

💡assumptions

Assumptions refer to the often unverified conditions and beliefs underlying statistical models and procedures. Common assumptions discussed include independent and identically distributed data, linear relationships, normality of data, etc. The video stresses assumptions must be kept in mind as model violations can render statistical analysis invalid.

💡exploratory data analysis

Exploratory data analysis involves preliminary investigation of data to understand key properties, patterns and relationships before formal modeling. The video recommends learning programming to facilitate such exploration through summary statistics, visualizations and more. This can guide choices involved in statistical analysis.

Highlights

Statistics is the study of data, which includes everything from data collection to data presentation.

The central object that we use to represent data is the random variable, which can take on different values with different probabilities.

The probability density function or probability mass function describes the probabilities associated with each value a random variable can take.

Measures of central tendency like the mean, median and mode describe typical values, while measures of scale like variance and standard deviation describe the spread of values.

Statisticians define a population, collect data from a sample, assume the data comes from a probability distribution, and try to infer the unknown population parameters.

Hypothesis tests allow us to make decisions by assuming a null hypothesis, seeing how likely our data would be under this assumption, and potentially rejecting this assumption.

There are many hypothesis tests for different types of data and questions, ranging from one sample tests to ANOVA and regression models.

Experimental design with randomization allows us to make causal claims, while observational data usually only provides correlational evidence.

Non-parametric models make fewer assumptions, while robust statistics enable proper inference even when assumptions fail.

Prediction tries to forecast future observations based on models fit to past data, connecting statistics to machine learning.

High dimensional statistics deals with more predictors than samples, while causal inference allows for making causal claims from observational studies.

Simulation studies test models before publication, so programming skills are important for statisticians to develop and evaluate methods.

R is a good programming language to learn for doing statistics since it specializes in data analysis and visualization.

Statistics requires hard work to master, but the growing need for data analysis means demand for statisticians will continue rising.

By learning statistics you'll be better equipped to uncover insights from data and trick people into thinking you're good at board games.

Transcripts

play00:00

the world is full of information and

play00:02

information is power as Tom Clancy once

play00:05

said if you can control information you

play00:08

can control the people but he never told

play00:10

us what to do with that information once

play00:12

we got it this video won't teach you how

play00:14

to control people but it'll at least

play00:16

tell you how to control information and

play00:18

that's what statistics is for for many

play00:20

people statistics was just one course we

play00:23

took and forgot about but for those that

play00:25

take it further they see the

play00:27

possibilities that strong statistical

play00:28

skills unlock you're not controlling

play00:31

people but you're paid nicely to handle

play00:33

data and information if you need more

play00:35

stats in your life but don't know where

play00:36

to start learning then welcome to the

play00:38

statistical 100 if you can Master these

play00:41

100 topics then you'll be one step

play00:42

closer to tricking people into thinking

play00:44

you're good at board games in the

play00:46

beginning there was Data data is a

play00:48

general catch-all term for information

play00:50

that we observe this information can be

play00:52

in number form also known as

play00:54

quantitative data or can be in word form

play00:56

known as qualitative data for this video

play00:59

we focus on old part numbers data can

play01:02

come in different flavors one of those

play01:04

flavors is discrete data represented by

play01:06

the integers one important example of

play01:08

discrete data is binary data which can

play01:11

only take two values zero and one zero

play01:14

and one are useful because they can

play01:15

represent on and off states such as true

play01:17

and false we can represent group

play01:19

membership with binary data using one to

play01:22

indicate that someone is a part of one

play01:23

group while zero can represent the other

play01:26

group this logic can be taken further

play01:28

with categorical data where there can be

play01:30

more than two groups another important

play01:32

example of discrete data is Count data

play01:34

represented by the positive integers the

play01:36

other flavor of data is continuous data

play01:39

represented by the entire number line

play01:40

continuous data is useful for things

play01:43

that fall in the Continuum like a

play01:44

clinical biomarker or age one important

play01:47

example of continuous data is time to

play01:49

event data which represents the amount

play01:51

of time until some event such as debt or

play01:53

remission there are many types of data

play01:55

but they're all haunted by the same

play01:57

demon Randomness Randomness prevents us

play02:00

from making perfect predictions with

play02:01

data and winning big at the casino 100

play02:03

of the time this raises an important

play02:06

question how can we still learn from

play02:08

data despite this Randomness statistics

play02:11

can be viewed as the study of data which

play02:13

includes everything from data collection

play02:15

to data presentation statisticians are

play02:17

in the business of looking past the

play02:19

randomness and data when we think of

play02:21

Randomness we usually think of it as

play02:22

chaotic and uncontrolled but if we

play02:25

assume that this Randomness has some

play02:27

kind of structure behind it then we can

play02:29

use this to our advantage this is where

play02:31

probability Theory enters statistics the

play02:33

central object that we use to represent

play02:35

data is the random variable a random

play02:37

variable can take on different values

play02:39

with different probabilities random

play02:41

variables are usually represented by

play02:43

capital letters while actual values

play02:45

taken from a random variable usually

play02:47

lowercase letter random variables have

play02:49

special functions that describe the

play02:50

probabilities associated with each value

play02:52

this function is called a probability

play02:54

density function or probability Mass

play02:57

function depending on the nature of the

play02:59

data the random variable needs to match

play03:01

the data so it can be either discrete or

play03:03

continuous the shape of a PDF describes

play03:05

the structure behind the randomness in

play03:07

the data you may also hear it described

play03:09

as the law of the data technically the

play03:11

distribution can take any shape but

play03:13

there are a few common ones you need to

play03:15

know about the uniform distribution

play03:16

tells us that all values are equally

play03:18

likely the Bernoulli distribution

play03:20

describes the distribution for a binary

play03:22

data and tells us How likely we'll

play03:24

observe a 1 which we call a success the

play03:26

binomial distribution is similar but

play03:28

tells us the probability for multiple

play03:30

coin flips or successes the poisson

play03:32

distribution describes counts and the

play03:34

most famous distribution of all is the

play03:36

normal distribution which has a

play03:38

characteristic Bell shape the normal

play03:39

distribution is used everywhere in

play03:41

statistics and it's the namesake of the

play03:43

channel the PDF is not the only way to

play03:45

describe Randomness in the data there's

play03:47

also the cumulative distribution

play03:48

function or CDF and the CDF is useful

play03:51

for defining quantiles and percentiles

play03:53

of a random variable there are other

play03:55

useful values that we use to

play03:56

characterize random data we might want

play03:58

to know what a typical value with

play04:00

typicalness is captured in the measures

play04:02

of central tendency the one most people

play04:04

know is the mean known in technical

play04:06

terms as the expectation or expected

play04:08

value another measure of typicalness is

play04:10

the median which marks the middle of a

play04:12

data set in terms of the CDF finally

play04:15

there's the mode which describes the

play04:16

most common value defined by the peak of

play04:18

the PDF we might also be interested in

play04:21

the range of values a random variable

play04:22

might take this can be described using

play04:24

the measures of scale the variance gives

play04:26

us a sense of how far values can be from

play04:28

the expected value and the standard

play04:30

deviation tells us the spread of data in

play04:32

terms of the original data units the

play04:34

measures of shape tell us more specific

play04:36

details about a shape of a probability

play04:38

distribution the skewness tells us the

play04:41

imbalance in the distribution towards

play04:42

one side or the other skewness implies

play04:45

the presence about liars or extreme

play04:46

values in a distribution kurtosis tells

play04:49

us about the pointiness of a

play04:50

distribution often we have to deal with

play04:52

functions or transformations of a random

play04:55

variable most commonly we deal with

play04:56

functions of normal random variables

play04:58

such as the T and case Squared

play05:00

Distribution other times we want to see

play05:02

how the probability of one random

play05:04

variable is influenced by another in

play05:06

this case as we want to know about the

play05:08

conditional probability of that random

play05:10

variable when random variables don't

play05:11

influence each other we think of them as

play05:13

independent another important concept

play05:15

using conditional probability is Bayes

play05:17

rule the Israel tells us that we should

play05:19

change our beliefs Based on data that we

play05:21

observe humans are natural bayesians but

play05:23

maybe not so much in this polarized

play05:25

World pager will gave rise to a

play05:27

framework of Statistics called

play05:28

bayesianism but most students are

play05:30

trained in frequent statistics instead

play05:32

these two schools have a lot of beef but

play05:34

that's a subject for another video now

play05:36

we'll use these probability tools to our

play05:38

advantage statisticians start by

play05:40

defining a population population is a

play05:42

group that we're interested in but often

play05:44

don't have the resources to fully

play05:45

observe instead we're forced to collect

play05:47

data from a small subset which we call a

play05:49

sample next we assume that the data was

play05:51

generated by a probability distribution

play05:53

or mathematical formula this assumption

play05:56

is our statistical model statisticians

play05:58

translate an aspect of this population

play05:59

into a parameter within this model

play06:02

because the population is unobservable

play06:04

this parameter is also unknown our goal

play06:07

is to use the data to construct the

play06:08

guests for the parameter which we call

play06:10

an estimator this process is called

play06:12

inferential statistics because we're

play06:14

trying to infer about an unknown

play06:16

population based on collected data this

play06:18

is distinct from descriptive statistics

play06:20

which are used to describe the data we

play06:22

collect the first estimator that people

play06:24

learn about is the sample mean we learn

play06:26

about the sample mean because it has

play06:27

many good qualities as an estimator the

play06:30

law of large numbers tells us that when

play06:31

we collect large amounts of data the

play06:33

sample mean will get very close to the

play06:35

population mean we call this consistency

play06:37

because samples are random by extension

play06:40

the sample mean is also random this

play06:42

means that estimators are also random

play06:44

variables and it's crucial that we

play06:46

understand the distribution of the

play06:48

estimator this distribution is so

play06:50

special we give it a name the sampling

play06:52

distribution if we know what it is we

play06:54

can tell if observing a single sample

play06:56

mean is likely or rare depending on the

play06:58

distribution we find the SIM Central

play07:00

limit theorem tells us that a function

play07:02

of the sample mean is a standard normal

play07:04

distribution assuming that we have lots

play07:06

of data the law of large numbers and the

play07:08

central limit theorem are examples of

play07:09

asymptotic theorems and they're the

play07:11

reason we try to get the biggest sample

play07:13

sizes we can when asymptotics don't

play07:15

apply we can possibly turn to other

play07:16

methods like the bootstrap statisticians

play07:19

translate beliefs about a population in

play07:21

two statements about the population

play07:23

parameters sampling distributions are

play07:25

crucial to understanding hypothesis

play07:27

tests there are two hypotheses we create

play07:29

in hypothesis test the first is the null

play07:32

hypothesis which represents a belief

play07:34

about the world that we want to disprove

play07:36

the second hypothesis is the alternative

play07:38

hypothesis which opposes the null as an

play07:40

example our parameter of interest will

play07:42

be the difference between treatment

play07:43

groups our null hypothesis is that there

play07:46

is no difference between the groups so

play07:47

the parameter is equal to zero as we

play07:50

collect data we have a decision to make

play07:51

we assume the null hypothesis is correct

play07:54

and extend our logic from there if we

play07:56

assume the null hypothesis is true it

play07:58

suggests that we have particular

play07:59

sampling distribution then we see where

play08:02

our estimator lies relative to this null

play08:04

distribution we want to know the

play08:06

probability of observing our sample mean

play08:08

or more extreme value this probability

play08:11

is known as the infamous p-value if this

play08:13

probability is low enough it suggests

play08:15

that it's unlikely that the world under

play08:17

the null hypothesis would have produced

play08:19

the sample mean that we got we can also

play08:21

make a decision based on a confidence

play08:22

interval a range of parameter values

play08:24

that could have realistically produced

play08:26

our sample mean if this interval doesn't

play08:28

contain the null hypothesis value then

play08:30

we can also reject there's a duality

play08:32

between p-values and confidence

play08:34

intervals so we know they'll lead to the

play08:36

same decision after making a decision

play08:38

there are two ways that we can be wrong

play08:39

a type 1 error happens when the truth is

play08:42

that the null hypothesis is actually

play08:43

correct but we decide to reject it this

play08:45

is like saying the treatment works when

play08:47

it actually doesn't a type 2 error

play08:49

happens when the null hypothesis is

play08:51

actually false but we fail to reject it

play08:53

this is like saying good medicine

play08:55

doesn't work ideally we want to minimize

play08:57

the probability that both of these

play08:59

errors occur minimizing one increases

play09:01

the chances of another instead we Define

play09:03

a low enough probability that we can

play09:05

tolerate for a type 1 error which we

play09:07

call the significance level after

play09:09

setting this we minimize the probability

play09:11

of a type 2 error this is also known as

play09:13

maximizing power

play09:15

[Applause]

play09:17

there are lots of hypothesis tests we

play09:19

can conduct depending on the question we

play09:21

want to answer if we want to

play09:22

characterize the population we can

play09:24

perform a one sample test but if we want

play09:26

to compare two groups we can use a two

play09:28

sample test the central limit theorem

play09:30

tells us that the sampling distributions

play09:31

for these will be normal and we can take

play09:33

advantage of this to produce a z

play09:35

statistic Z is usually used to denote a

play09:37

standard normal variable with zero mean

play09:39

and unit variance C statistics assume

play09:42

that we know the population variance but

play09:44

this is unrealistic in practice if we

play09:46

have to estimate this too it converts

play09:48

the Z statistic into a t statistic don't

play09:50

be surprised but a t statistic comes

play09:53

from a t distribution which has a

play09:54

slightly wider shape than a normal if

play09:56

we're comparing three groups we can use

play09:58

an analysis of variance or Anova to

play10:00

check if they'll have the same mean all

play10:02

of these tests assume continuous data or

play10:04

large sample sizes but if we're dealing

play10:06

with binary data we can construct the

play10:08

contingency table and perform a

play10:10

chi-square test these hypotheses tests

play10:12

are all types of univari analyzes since

play10:14

they focused on single random variables

play10:16

if we want to check relationships

play10:18

between variables we need regression

play10:20

linear regression lets us see how one

play10:22

variable influences another if the

play10:24

outcome is binary or a count then we can

play10:26

use a generalized linear model instead

play10:28

to estimate the parameters in these

play10:30

regression models we need to turn the

play10:31

maximum likelihood estimation or an

play10:34

optimization algorithm like

play10:35

newton-raphson you might suspect that

play10:37

treatment effects will vary over time so

play10:39

you can collect data from people across

play10:41

multiple occasions if you do this you'll

play10:43

no longer have independent and

play10:44

identically distributed data so you'll

play10:46

need to shift to longitudinal modeling

play10:48

for this we can use a GE model or a

play10:50

mixed effect model to account for the

play10:52

clustering effects we may also want to

play10:54

include multiple predictors in all of

play10:56

these models and choosing this set is

play10:57

called variable selection we can do this

play10:59

by asking experts in the field or

play11:01

checking past research another rule of

play11:03

thumb is to include potential

play11:04

confounders which can muddy the

play11:06

predictor outcome relationship if you

play11:08

don't account for them it's very

play11:09

important to know how data has been

play11:10

collected if you have data from a

play11:12

randomized controlled trial the results

play11:14

from your experiment could be considered

play11:16

causal instead of correl relational

play11:17

without this randomization our data

play11:20

comes from an observational design and

play11:22

we definitely can make causal statements

play11:23

with it this is why statisticians care

play11:25

heavily about experimental design so

play11:27

that we can know precisely what we can

play11:29

conclude from our data in statistics we

play11:31

must always keep our assumptions in mind

play11:33

models are assumptions themselves and we

play11:36

may have more depending on the model the

play11:37

models I've discussed so far are

play11:39

examples of parametric statistics if we

play11:42

don't want to use a parametric model we

play11:44

can use a non-parametric model instead

play11:46

for example the man Whitney test is a

play11:48

non-parametric form of the two-sample

play11:50

t-test then there's also semi-parametric

play11:52

statistics the most famous

play11:54

semi-parametric model is the Cox model

play11:56

used in survival analysis one part of

play11:58

the model is parametric which describes

play12:00

how survival changes with the treatment

play12:02

while the non-parametric part is an

play12:04

entire function called the hazard

play12:05

function inference and description are

play12:07

not the only statistical goals there's

play12:09

also prediction where we try to predict

play12:11

the value of a future observation based

play12:13

on a Model we've estimated this starts

play12:15

to venture into the field of machine

play12:16

learning where you'll start to see black

play12:18

box models modern statisticians deal

play12:20

with very specific but exciting modeling

play12:22

problems it's very common to assume that

play12:24

the number of predictors is much less

play12:26

than the sample size but in feels like

play12:28

genetics this is rarely the case so we

play12:30

need High dimensional statistics and

play12:32

other exciting areas causal inference

play12:34

which encompasses a set of techniques

play12:36

that allow us to make causal statements

play12:38

from observational data one of the

play12:40

pivotal ideas in causal inference is the

play12:42

counterfactual framework as I've

play12:43

mentioned before we need several

play12:45

assumptions and statistics if these

play12:47

assumptions are violated then our models

play12:49

are useless some reachers develop robust

play12:51

statistics that will enable proper

play12:53

inference even if these assumptions are

play12:55

wrong if you're excited to start doing

play12:57

statistics how do you start I recommend

play12:59

learning a statistical programming

play13:01

language so you can start playing with

play13:02

these ideas python is good but it's a

play13:05

general use language I recommend picking

play13:07

up R since it's dedicated to statistical

play13:09

analysis R makes it easier to examine

play13:11

data and perform exploratory data

play13:13

analyzes that can help inform how we

play13:15

model data statistician use programming

play13:18

to do extensive simulation studies to

play13:20

test new models before they can publish

play13:22

their work so that's also another skill

play13:23

to learn finally there's no free lunch

play13:25

and statistics statistics is hard work

play13:28

and because she jobs aren't easily

play13:29

earned everyone has data so everyone

play13:31

will eventually need a statistician so

play13:34

hopefully by watching this video someone

play13:35

will finally need you as well thanks for

play13:37

watching and I'll see you in the next

play13:39

one

play13:40

foreign