How to Create Horizontal Scroll Bar with Fixed Y Scale in Chart JS
Summary
TLDRThis video tutorial guides viewers on creating a horizontal scrollbar in a chart while keeping the Y-axis labels fixed, ensuring readability of values. It covers duplicating chart sections, adjusting variables, and utilizing CSS for positioning. The tutorial also explains removing excess data, legends, and tick marks for a cleaner look, and aligning the scrollbar with the chart for a seamless user experience. It concludes with tips on creating a custom HTML legend for a complete chart setup.
Takeaways
- 🌐 The video focuses on creating a horizontal scrollbar in a chart while keeping the Y-axis labels fixed and visible.
- 📝 It instructs to start by visiting Chart.js and using a boilerplate template provided in the video description.
- 📋 The process involves duplicating the chart section to create two charts: one for the scale area and another for the bar values.
- 🔗 It's important to adjust variables and constants, and to remove excess data that isn't needed for the specific functionality.
- 📏 The script guides on setting up CSS for positioning and width to create a scroll effect within the chart.
- 📊 To achieve the desired layout, the video explains how to use CSS Flexbox to place charts side by side.
- 🖌️ It covers how to adjust the chart's size and appearance by manipulating CSS properties like width, max-width, and overflow.
- 🔍 The tutorial includes steps to remove chart legends and customize the appearance of the chart to fit the design requirements.
- 📉 The video explains how to handle the Y-axis, ensuring it remains fixed while the X-axis data can scroll horizontally.
- 🛠️ It provides a method to adjust the chart's padding to accommodate for the scrollbar and to prevent overlapping elements.
- 🔧 The final part of the script discusses creating a custom HTML legend for the chart and aligning it properly with the data.
Q & A
What is the main focus of the video?
-The main focus of the video is to demonstrate how to create a horizontal scrollbar in a chart while keeping the Y-axis labels fixed in position.
Where can viewers find the boilerplate template for the chart?
-Viewers can find the boilerplate template on charges3.com by following the specific link provided in the video description.
What are the two main parts of the chart being created in the video?
-The two main parts of the chart being created are one that shows the scale area and another that displays all the bar values.
How does duplicating the chart section help in creating the two charts?
-Duplicating the chart section allows for the creation of two separate charts, one for the scale area and another for the bar values, by modifying and adjusting the copied section.
What is the purpose of using the 'column small' and 'column large' classes in the video?
-The 'column small' and 'column large' classes are used to control the positioning and width of the chart elements, making one chart scrollable while keeping the other fixed.
Why is it important to set the 'maintainAspectRatio' property to false for both charts?
-Setting 'maintainAspectRatio' to false allows the charts to maximize their size within the div container, preventing them from expanding automatically to infinity.
How does removing the tick labels and tick marks from the Y-axis in chart one affect the visualization?
-Removing the tick labels and tick marks from the Y-axis in chart one cleans up the visualization, making it less cluttered and focusing the attention on the bar values.
What is the purpose of setting a fixed height for the chart container?
-Setting a fixed height for the chart container ensures that the chart has a consistent size, making it easier to manage and view the data, especially when scrolling.
How does the video address the issue of overlapping elements in the chart?
-The video addresses the issue of overlapping elements by adjusting the padding and layout properties, ensuring that the scrollbar does not overlap with the chart elements.
What additional feature is recommended for enhancing the chart's usability in the video?
-The video recommends adding a customized HTML legend to enhance the chart's usability, providing a clear and static reference for the chart data as the user scrolls.
Outlines

This section is available to paid users only. Please upgrade to access this part.
Upgrade NowMindmap

This section is available to paid users only. Please upgrade to access this part.
Upgrade NowKeywords

This section is available to paid users only. Please upgrade to access this part.
Upgrade NowHighlights

This section is available to paid users only. Please upgrade to access this part.
Upgrade NowTranscripts

This section is available to paid users only. Please upgrade to access this part.
Upgrade NowBrowse More Related Video
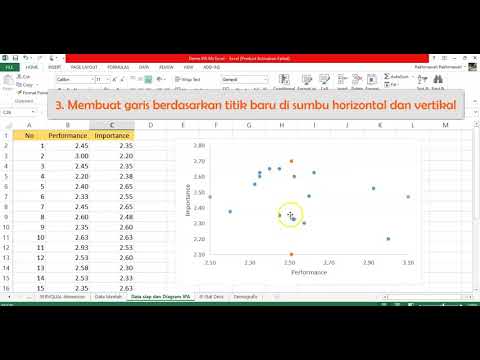
7 Diagram IPA Ms Excel (2) | Importance Performance Analysis Ms Excel
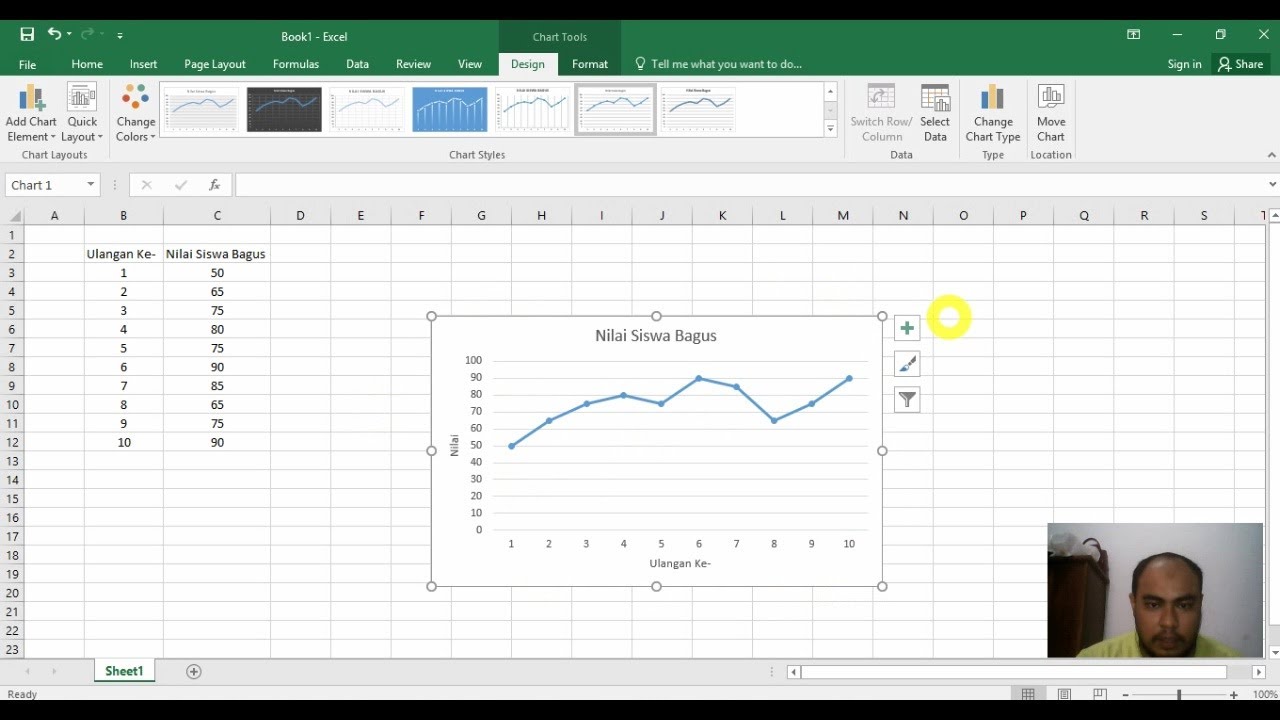
How to Make a Graph in Excel | Learn Microsoft Excel

Visualisasi Data dengan Chart Microsoft Excel
Cara Membuat Grafik di Excel Untuk Pemula
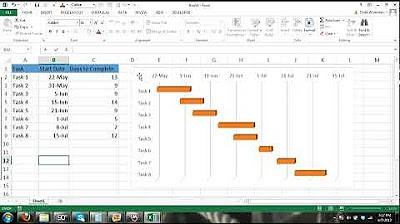
Gantt Chart Excel Tutorial - How to make a Basic Gantt Chart in Microsoft Excel

The Best Way to Make a Perceptual Map in Excel
5.0 / 5 (0 votes)