Bagaimana cara menggunakan ichimoku cloud , dan supply demand #Answeryourquestion Ep14
Summary
TLDRThis video provides an in-depth explanation of supply and demand concepts in trading and how to identify key price areas on charts. The host discusses leverage management, emphasizing the importance of using moderate leverage to control risk, and explains compounding profits for consistent growth. Practical trading strategies are shared, including the use of Ichimoku Cloud and Moving Averages to spot trends, entries, and exits. Viewers also learn about setting stop-loss and take-profit levels effectively. The content balances technical analysis with risk management tips, making it suitable for both beginners and more experienced traders aiming to improve their market predictions and trading efficiency.
Takeaways
- 📈 Supply and demand zones are key areas on a chart where price reacts significantly, similar to support and resistance but focused on major price movements.
- 💡 Supply zones indicate areas where price tends to drop sharply, while demand zones indicate areas where price tends to rise sharply.
- ⚖️ Leverage allows traders to control larger positions than their actual capital, but higher leverage increases risk.
- 🔰 For beginners, using a lower leverage like 1:100 is safer to manage potential losses.
- 🖇️ Leverage affects the lot size that can be traded, not the number of trades per day.
- 💹 Consistent monthly profit can be compounded to grow capital, with risk always calculated based on the current balance.
- 💰 Partial withdrawal of profits is recommended to allow the trading account to continue growing.
- 🖥️ Trading can be done with any account type (micro, standard, or sen); success depends on chart reading skills rather than account type.
- ☁️ The Ichimoku Cloud indicator helps identify trends: above the cloud indicates bullish, below indicates bearish, and crossover points act as entry signals.
- 🛑 Stop loss and take profit levels can be flexible, adjusted based on timeframe and volatility, and should be determined using backtesting.
- 🎯 Effective trading relies on risk management, chart analysis, and understanding price behavior, rather than relying solely on indicators or account type.
Q & A
What is the concept of supply and demand in trading according to the transcript?
-Supply and demand in trading refers to areas on the chart where prices react significantly. Supply zones are where prices drop drastically after reaching a high, while demand zones are where prices rise sharply after hitting a low. These areas are crucial for predicting price movements.
How can supply and demand zones be identified on a chart?
-They can be identified by looking for areas where prices have previously reversed sharply. Drawing horizontal lines at these points helps mark significant supply (resistance) and demand (support) zones for future reference.
What is the difference between support/resistance and supply/demand?
-While both concepts involve key price levels, support and resistance are general areas where prices tend to stall or reverse. Supply and demand zones focus specifically on significant price movements and the strength of buyers or sellers in those areas.
How should a beginner choose leverage for trading?
-Beginners are recommended to use smaller leverage, such as 1:100, to reduce risk. Higher leverage can increase both potential profits and potential losses, so using a lower ratio helps manage risk more effectively.
Does leverage affect the number of trades you can make in a day?
-No, leverage primarily affects the position size (lot size) you can use, not the number of trades. The total number of trades depends on the trader's strategy and account rules.
What is compounding in trading as described in the transcript?
-Compounding involves reinvesting profits back into the account so that the trading size adjusts according to the new balance. This allows profits to grow while maintaining the same risk percentage relative to the updated account balance.
What are some recommended strategies for managing profits in trading?
-Instead of withdrawing all profits, the transcript suggests taking partial profits, such as 30–50%, and leaving the rest to grow in the account. This approach allows the trading account to develop steadily over time.
How does the Ichimoku Cloud indicator help in trading?
-The Ichimoku Cloud helps identify trends and potential entry points. Price above the cloud indicates a bullish trend, while price below indicates a bearish trend. Crossovers and rejections near the cloud can act as signals for entering or exiting trades.
How should stop-loss and take-profit levels be determined?
-Stop-loss levels vary depending on the chart timeframe and recent price action, while take-profit levels can use a risk-reward ratio, such as 1:2 or 1:3. Traders can also use backtesting to determine typical daily price movements for setting limits.
What is the advice regarding learning trading strategies?
-Start by learning on your own (autodidact), then consider learning from multiple mentors to combine insights into a personal trading system. Understanding price action, supply and demand zones, and indicators is more important than the type of account used.
Outlines

This section is available to paid users only. Please upgrade to access this part.
Upgrade NowMindmap

This section is available to paid users only. Please upgrade to access this part.
Upgrade NowKeywords

This section is available to paid users only. Please upgrade to access this part.
Upgrade NowHighlights

This section is available to paid users only. Please upgrade to access this part.
Upgrade NowTranscripts

This section is available to paid users only. Please upgrade to access this part.
Upgrade NowBrowse More Related Video
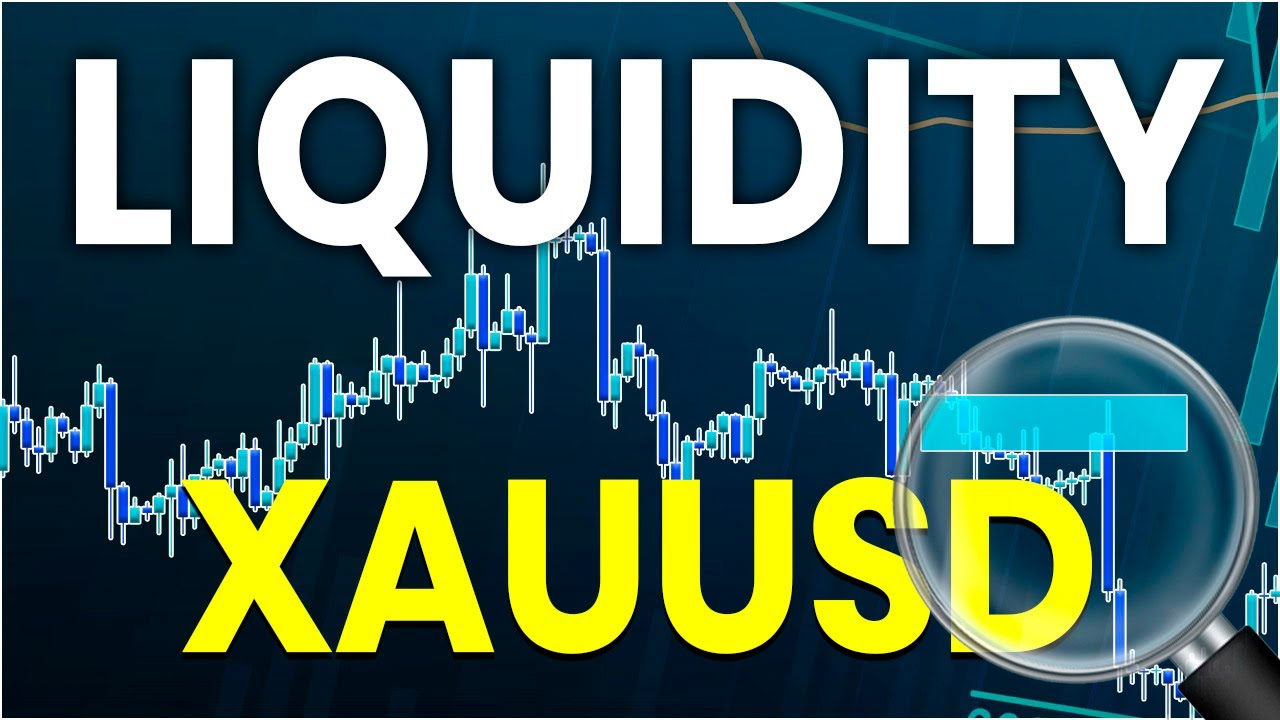
How to Find Liquidity Zones on Gold Chart Easily (XAUUSD analysis)

Aplikasi fungsi linear : fungsi pemrintaan & penawaran

Cómo Saber Si El Precio Seguirá Con La Tendencia
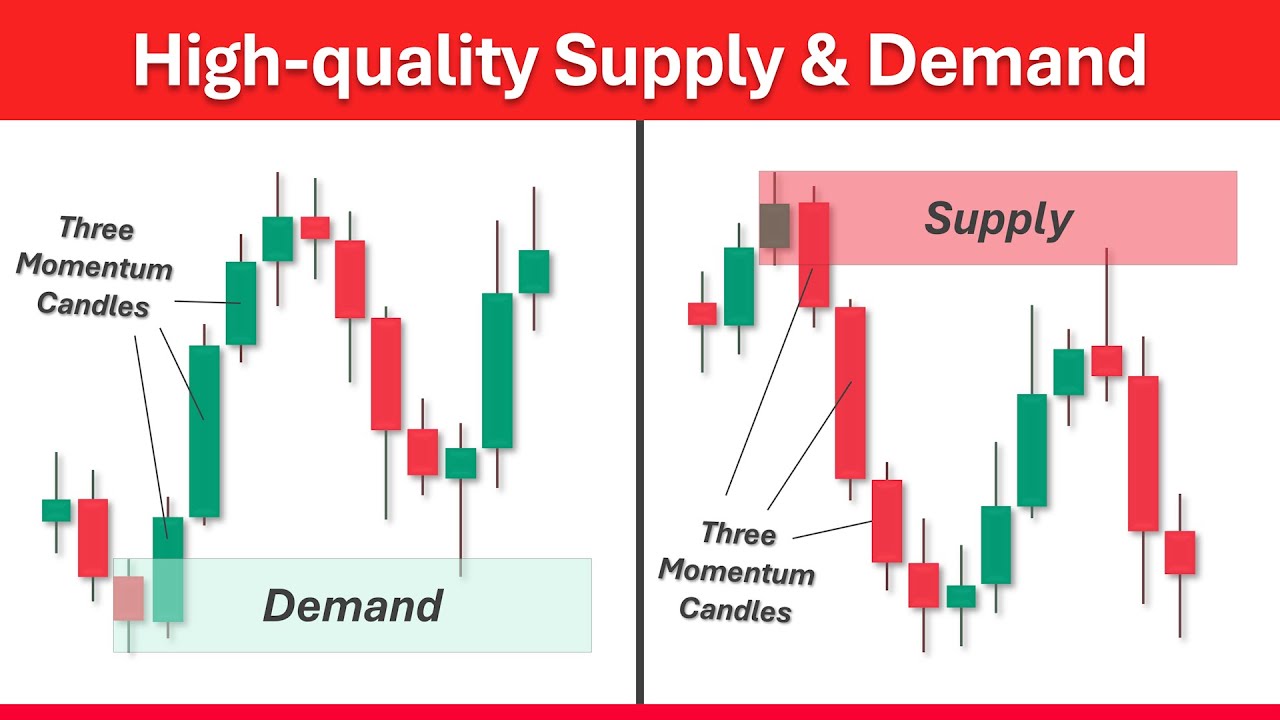
Best Supply and Demand Trading Strategy Explained (2026 Guide)

ICT Market Maker Model - Explained In-depth!
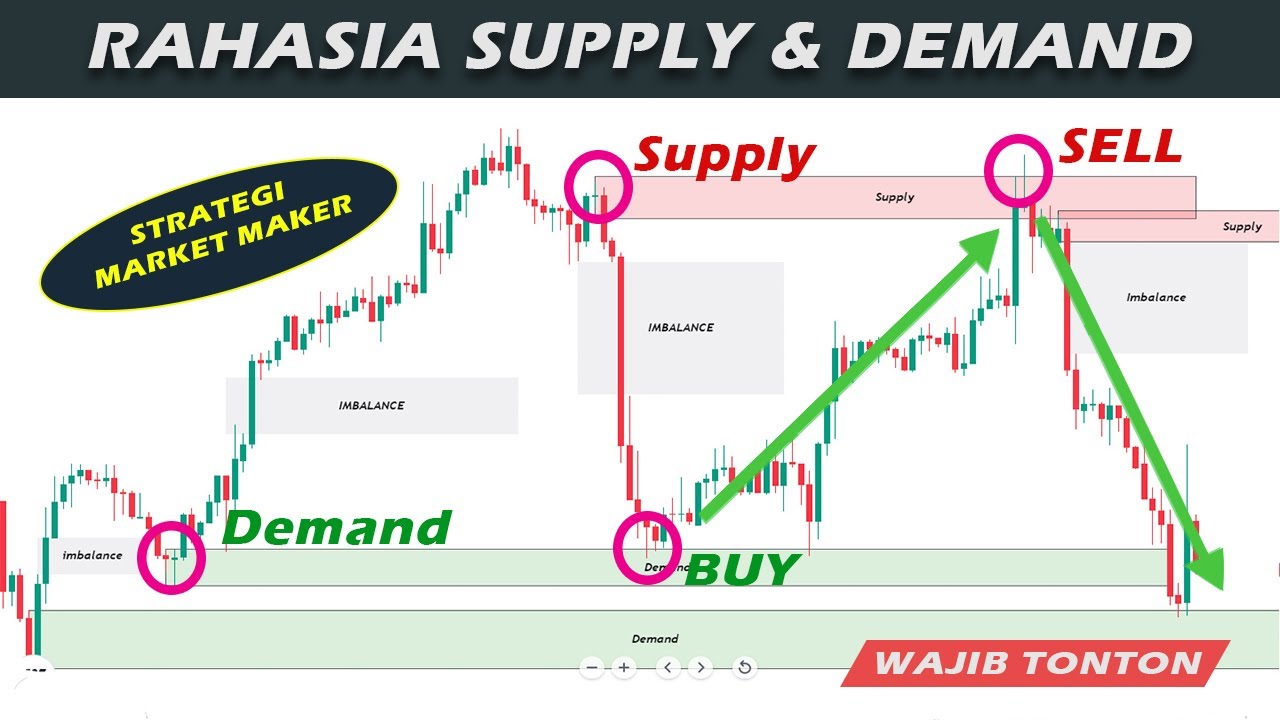
The Secrets of Market Logic | Smart Money Concept, Supply & Demand, Beginner | Market Maker Logic
5.0 / 5 (0 votes)