Cara Uji Normalitas dan Homogenitas Menggunakan SPSS dengan Mudah
Summary
TLDRIn this tutorial video, the presenter explains how to perform normality and homogeneity tests using SPSS software. The video starts with an introduction to the concepts of normality and homogeneity, followed by detailed instructions on how to input data into SPSS. The presenter demonstrates how to conduct normality tests using Kolmogorov-Smirnov and Shapiro-Wilk tests, and how to interpret the results. Next, the homogeneity test is explained using the One-Way ANOVA test. The video provides clear, step-by-step guidance to help students and researchers perform these statistical tests with ease.
Takeaways
- 😀 Learn how to perform normality and homogeneity tests using SPSS.
- 😀 Normality tests assess whether data follows a normal distribution, using tests like Kolmogorov-Smirnov.
- 😀 A data set is considered normal if the significance value is greater than 0.05.
- 😀 Homogeneity tests check whether the data has a consistent variance across groups.
- 😀 SPSS is an effective tool for conducting statistical tests without the need for complex formulas.
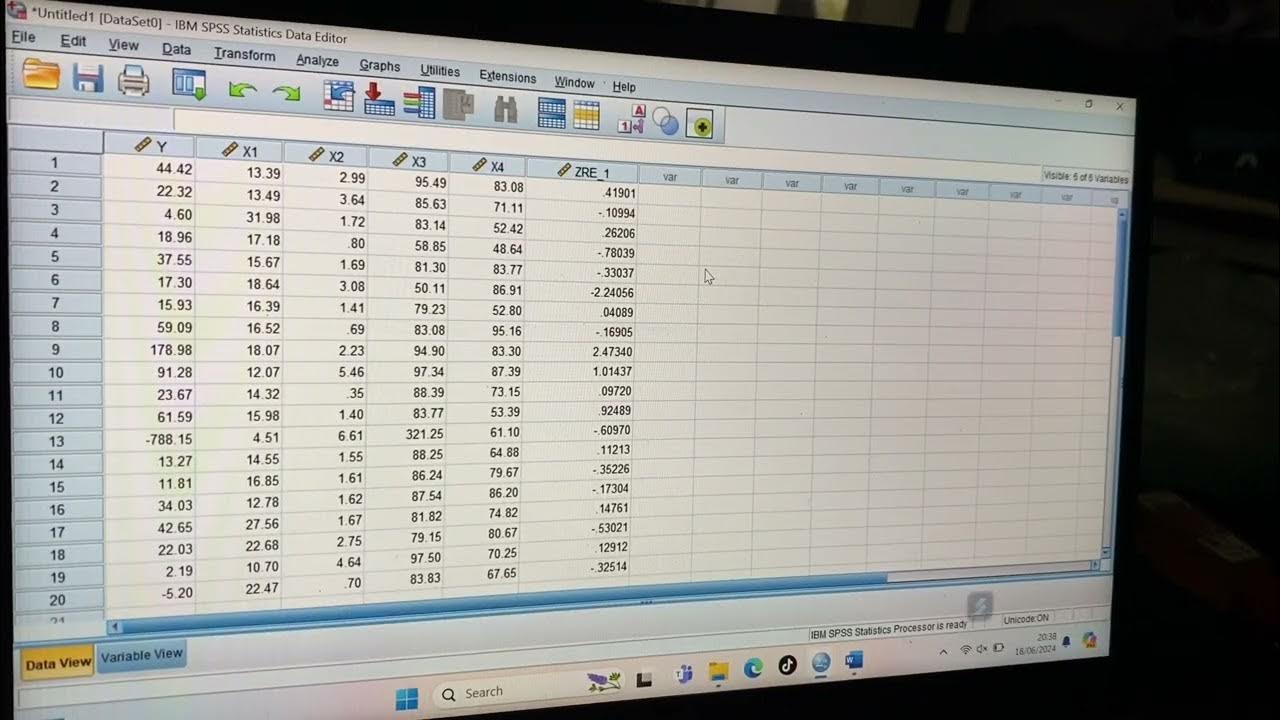
- 😀 Data input in SPSS is crucial: make sure to define variables properly (e.g., decimal places for data).
- 😀 Descriptive statistics in SPSS help you understand basic data properties like mean, median, and range.
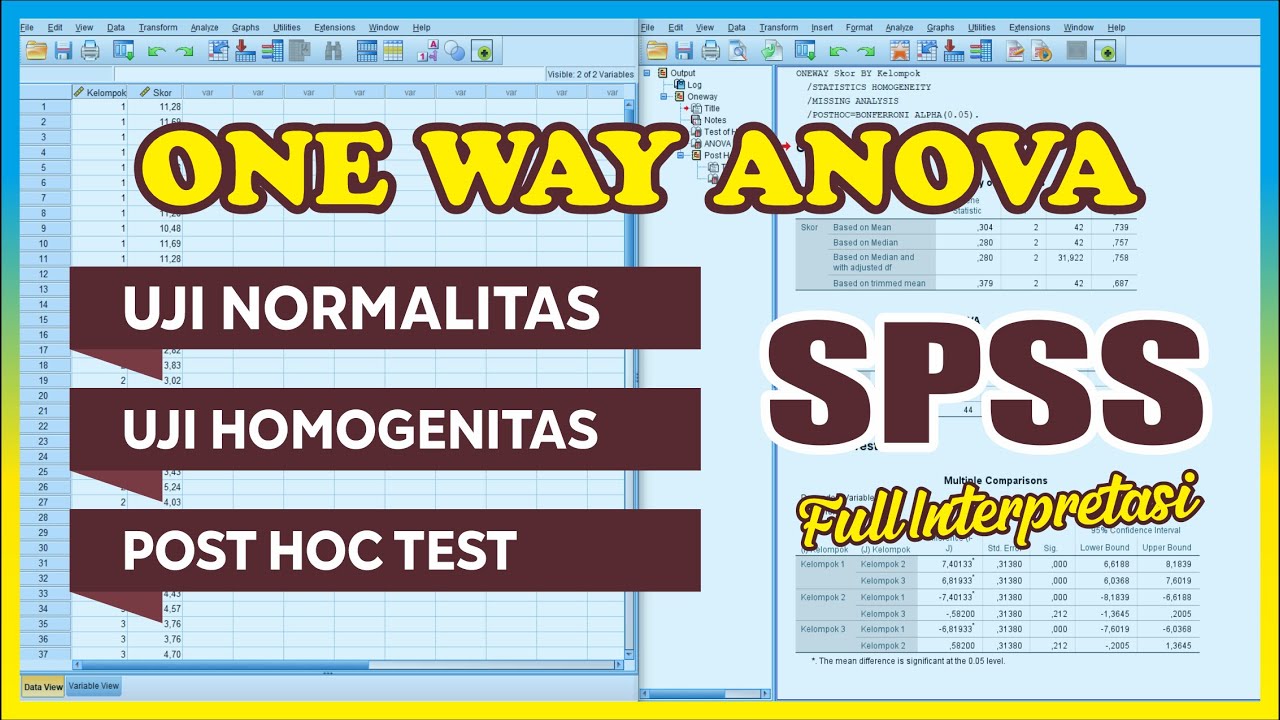
- 😀 For homogeneity testing, use One-Way ANOVA in SPSS, which compares means between groups.
- 😀 A significance value greater than 0.05 in homogeneity tests indicates that the data is homogeneous.
- 😀 The tutorial shows how to copy and paste SPSS output into a Word document for reporting results.
- 😀 The video is designed for students working on research or statistics courses, especially for thesis and dissertation projects.
Q & A
What is the purpose of the normality test in statistics?
-The purpose of the normality test is to assess whether the data distribution is normal or not, meaning whether the data follows a Gaussian or bell-shaped curve.
How do you interpret the results of a normality test in SPSS?
-In SPSS, the normality test result is considered normal if the significance value is greater than 0.05. If the significance is more than 0.05, the data is deemed to be normally distributed.
What are the two common normality tests mentioned in the script?
-The two common normality tests mentioned are the Kolmogorov-Smirnov test and the Shapiro-Wilk test.
How do you conduct a normality test in SPSS using the example provided?
-In SPSS, after entering your data, go to 'Descriptive Statistics', then click on 'Explore'. After selecting the variable to test, click on the 'Normality Plots with Tests' option and run the test. If the significance is more than 0.05, the data is considered normal.
What does a significance value of 0.2 in the normality test indicate?
-A significance value of 0.2 indicates that the data is normally distributed, as it is greater than the 0.05 threshold.
What is the purpose of the homogeneity test in statistics?
-The homogeneity test checks whether the variance across different groups or samples is equal, which is crucial in statistical tests like ANOVA.
How do you test for homogeneity in SPSS using the example?
-In SPSS, after entering your data, go to 'Analyze', then 'Compare Means', and choose 'One-Way ANOVA'. In the options, select 'Homogeneity of Variance' to perform the homogeneity test.
What does a significance value of 0.20 in the homogeneity test indicate?
-A significance value of 0.20 indicates that the data is homogeneous, as it is greater than the 0.05 threshold for homogeneity.
What data entry procedure is required before running the tests in SPSS?
-Before running the tests in SPSS, the data must be entered into the SPSS 'Data View'. The variables such as the group name (e.g., SMA 1, SMA 2) and the numerical values (e.g., exam scores) must be appropriately defined.
What does the term 'homogeneity' refer to in the context of statistical testing?
-Homogeneity refers to the assumption that different groups or samples have the same variance. This is important in tests like ANOVA, where the variances of the groups being compared should be similar for accurate results.
Outlines

This section is available to paid users only. Please upgrade to access this part.
Upgrade NowMindmap

This section is available to paid users only. Please upgrade to access this part.
Upgrade NowKeywords

This section is available to paid users only. Please upgrade to access this part.
Upgrade NowHighlights

This section is available to paid users only. Please upgrade to access this part.
Upgrade NowTranscripts

This section is available to paid users only. Please upgrade to access this part.
Upgrade NowBrowse More Related Video

TENTANG UJI ASUMSI (NORMALITAS, LINEARITAS, HOMOGENITAS)

Uji Normalitas Menggunakan SPSS
Tutorial Menggunakan Spss untuk data Panel
Very Complete !! SPSS Anova Test – One-Way Anova with Post Hoc Test Anova SPSS

#2- UJI NORMALITAS DATA KELAS EKSPERIMEN DAN KELAS KONTROL MENGGUNAKAN SPSS
One Way Analysis of Variance
5.0 / 5 (0 votes)