Regresi linear, koefisien korelasi dan koefisien determinasi, by Top Mat
Summary
TLDRThis video provides an in-depth explanation of linear regression, correlation coefficients, and coefficient of determination in statistics. The instructor demonstrates how to calculate key values using Excel, including the mean of independent and dependent variables, sum of squares (SSXY, SSXX, SSYY), and the regression line equation. Additionally, the video covers the interpretation of the correlation coefficient, explaining the trend and strength of the correlation. The coefficient of determination is also discussed, and the video concludes with a discussion of how age influences heart rate, along with a graphical representation of the results.
Takeaways
- 😀 The video discusses linear regression, correlation coefficient, and determination coefficient as part of statistics.
- 😀 The independent variable in this example is 'age' (in years), while the dependent variable is 'heart rate' (beats per minute).
- 😀 The mean of the independent variable (age) is calculated using Excel by summing all values and dividing by the number of data points.
- 😀 Similarly, the mean of the dependent variable (heart rate) is calculated using Excel.
- 😀 To calculate SSxy, SSxx, and SSyy, Excel formulas are used for multiplication, squaring values, and summing results.
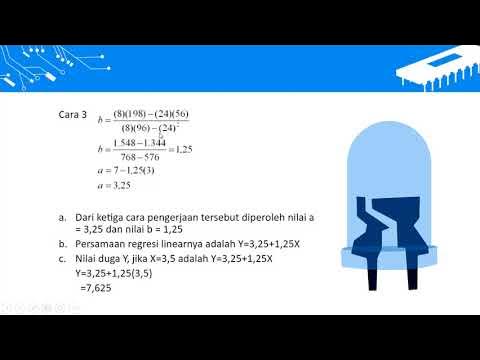
- 😀 The regression line equation is expressed as y = a + b * x, where 'b' (slope) is calculated using the formula SSxy / SSxx.
- 😀 The constant 'a' is calculated by subtracting the product of 'b' and the mean of the independent variable from the mean of the dependent variable.
- 😀 The correlation coefficient 'r' is calculated using the formula SSxy / √(SSxx * SSyy), yielding a value of 0.8567, which indicates a strong positive correlation.
- 😀 The trend of the data is described as linear and positive based on the correlation coefficient.
- 😀 The coefficient of determination (R^2) is calculated by squaring the correlation coefficient, resulting in a value of approximately 0.73, or 73%.
- 😀 The impact of the independent variable (age) on the dependent variable (heart rate) is 73.39%, with other factors contributing the remaining 26.61%.
Q & A
What is the main topic of the video?
-The main topic of the video is linear regression, including the calculation of correlation coefficient and coefficient of determination using statistical formulas and Excel.
What are the independent and dependent variables in the given data?
-In the data, age (usia) is the independent variable, and heart rate (detak jantung) is the dependent variable.
How is the average of the independent variable calculated in Excel?
-The average of the independent variable (age) is calculated using the formula =SUM(range) / number of data points, where 'range' is the selected data, and the number of data points is 10.
How is the sum of XY (ΣXY) calculated?
-ΣXY is calculated by multiplying the corresponding values of the independent and dependent variables for each data point and summing the results.
What formula is used to calculate SSXY, SSXX, and SSYY?
-The formula for SSXY is ΣXY - (ΣX * ΣY / n), for SSXX it is ΣX² - (ΣX)² / n, and for SSYY it is ΣY² - (ΣY)² / n, where n is the number of data points.
How is the regression equation formulated?
-The regression equation is formulated as Y = A + B * X, where B is calculated as SSXY / SSXX, and A is calculated as Ȳ - B * X̄, where Ȳ and X̄ are the averages of Y and X respectively.
How is the correlation coefficient (R) calculated?
-The correlation coefficient (R) is calculated using the formula R = SSXY / √(SSXX * SSYY). This measures the strength and direction of the linear relationship between the variables.
What does a positive R value indicate in terms of correlation?
-A positive R value indicates a positive linear correlation, meaning as the independent variable (age) increases, the dependent variable (heart rate) also tends to increase.
What does the coefficient of determination (R²) represent?
-The coefficient of determination (R²) represents the proportion of the variance in the dependent variable that can be explained by the independent variable. In this case, it shows how much of the variation in heart rate can be explained by age.
What does the coefficient of determination value of 0.73 mean in this case?
-A coefficient of determination of 0.73 means that 73% of the variation in heart rate can be explained by age, while the remaining 27% is influenced by other factors.
Outlines

This section is available to paid users only. Please upgrade to access this part.
Upgrade NowMindmap

This section is available to paid users only. Please upgrade to access this part.
Upgrade NowKeywords

This section is available to paid users only. Please upgrade to access this part.
Upgrade NowHighlights

This section is available to paid users only. Please upgrade to access this part.
Upgrade NowTranscripts

This section is available to paid users only. Please upgrade to access this part.
Upgrade NowBrowse More Related Video
Modul 12 (StatSos2) - Konsep Dasar Regresi Linear Sederhana

Regresi dan Korelasi Sederhana

Statistika 2_Modul 3_Adinda Fidya Anggun Pratiwi

Analisis Regresi Sederhana - Statistika Ekonomi dan Bisnis Lanjutan (Statistik 2) | E-Learning STA
METODE NUMERIK 11 REGRESI LINIER
STATISTICA parte 2.3 : correlazione e regressione
5.0 / 5 (0 votes)