Regresi Linier bab Statistika Regresi MATEMATIKA kelas 11 | Matematika wajib kelas 11 kurmer
Summary
TLDRIn this educational video, the instructor discusses linear regression and how to apply it in real-world problems. Key topics include understanding the regression equation, identifying the components of a regression line (slope and constant), and applying these concepts to specific data sets. The instructor walks through the process of calculating regression coefficients using example problems, helping viewers understand both the theory and practical application of regression analysis. The session emphasizes problem-solving techniques, statistical calculations, and the use of regression for predictions, with a focus on interactive learning.
Takeaways
- 😀 The lesson focuses on applying linear regression theory to solve practical problems, not on explaining the theory itself.
- 😀 The general formula for a regression line is ŷ = mx + c, where m is the regression coefficient and c is the constant.
- 😀 For the first example, the given regression equation is ŷ = 34.5x + 0.25, which was directly constructed from the provided coefficient and constant.
- 😀 In the second example, a scatter plot is used to derive the regression line using the equation for a linear line, ŷ - y₁ / y₂ - y₁ = x - x₁ / x₂ - x₁.
- 😀 The process for calculating the regression equation involves using two points from the scatter plot to derive the equation.
- 😀 In another example, the regression formula is derived using data, involving sigma notation for summing values like Σx, Σy, and Σxy.
- 😀 The calculation of x̄ (mean of x) and ȳ (mean of y) is necessary to proceed with the regression calculation, helping find the constants.
- 😀 Key formulas for regression include SSxy = Σxy / n - x̄ * ȳ and SSxx = Σx² / n - x̄², which are used to find the regression line.
- 😀 The process includes calculating the sums of products and squared values to derive values for the constants in the regression equation.
- 😀 The lesson also covers real-world examples, such as predicting the price of a used car based on its age, where the regression model is applied to estimate the car's price.
Q & A
What is the general formula for a linear regression equation?
-The general formula for a linear regression equation is: ŷ = mx + c, where ŷ is the predicted value of y, m is the regression coefficient (slope), x is the independent variable, and c is the constant (intercept).
How do you form the regression equation when the coefficient and constant are given?
-If the regression coefficient (m) and the constant (c) are given, you simply substitute these values into the general formula. For example, if m = 34.5 and c = 0.25, the regression equation would be: ŷ = 34.5x + 0.25.
How do you calculate a regression line from a set of data points?
-To calculate a regression line from a set of data points, you can use the formula: (ŷ - y₁) / (y₂ - y₁) = (x - x₁) / (x₂ - x₁). After substituting the points, you simplify the equation to find the regression line.
What is the significance of Sigma notation in regression calculations?
-Sigma notation is used to sum values in regression calculations, such as the sum of x-values (Σx), the sum of y-values (Σy), and the sum of products of x and y-values (Σxy). These summations help compute the necessary values for regression, such as means and regression coefficients.
What does the formula for SSxy represent in regression analysis?
-The formula for SSxy (sum of squares of the product of x and y) helps calculate the covariance between x and y. It is used to determine the regression coefficient (m) and is calculated as: SSxy = Σxy / n - (x̄ * ȳ), where n is the number of data points, x̄ is the mean of x, and ȳ is the mean of y.
How do you calculate the slope (m) of a regression line?
-The slope (m) of a regression line is calculated using the formula: m = SSxy / SSxx, where SSxy is the sum of squares of the product of x and y, and SSxx is the sum of squares of x.
What is the role of the x̄ and ȳ values in regression analysis?
-In regression analysis, x̄ (the mean of x) and ȳ (the mean of y) are used to center the data. These values are necessary for calculating the regression coefficients and for determining the predicted values of y (ŷ).
How do you find the regression equation using SSxy and SSxx?
-Once you have calculated SSxy and SSxx, the regression equation is formed by substituting these values into the formula: ŷ = m(x - x̄) + ȳ, where m is the slope calculated as SSxy / SSxx.
What steps are involved in predicting values with a regression model?
-To predict values with a regression model, substitute the given x-value into the regression equation. For example, if the regression equation is ŷ = -24x + 2304, and you want to predict the value for x = 6, you substitute x = 6 into the equation to find ŷ.
How do you interpret the results of a regression equation in practical scenarios?
-In practical scenarios, the regression equation helps predict the dependent variable (y) based on the independent variable (x). For example, if the regression equation models the price of a used car based on its age, you can use the equation to estimate the car's price at any given age.
Outlines

This section is available to paid users only. Please upgrade to access this part.
Upgrade NowMindmap

This section is available to paid users only. Please upgrade to access this part.
Upgrade NowKeywords

This section is available to paid users only. Please upgrade to access this part.
Upgrade NowHighlights

This section is available to paid users only. Please upgrade to access this part.
Upgrade NowTranscripts

This section is available to paid users only. Please upgrade to access this part.
Upgrade NowBrowse More Related Video
SPLTV Kelas 10 Kurikulum Merdeka
Data Mining 10 - Estimation (Linear Regression)

Simple Linear Regression: An Easy and Clear Beginner’s Guide
79% of Regression Analysis Basics in under 18 Minutes [Simple, Multiple and Logistic Regression]
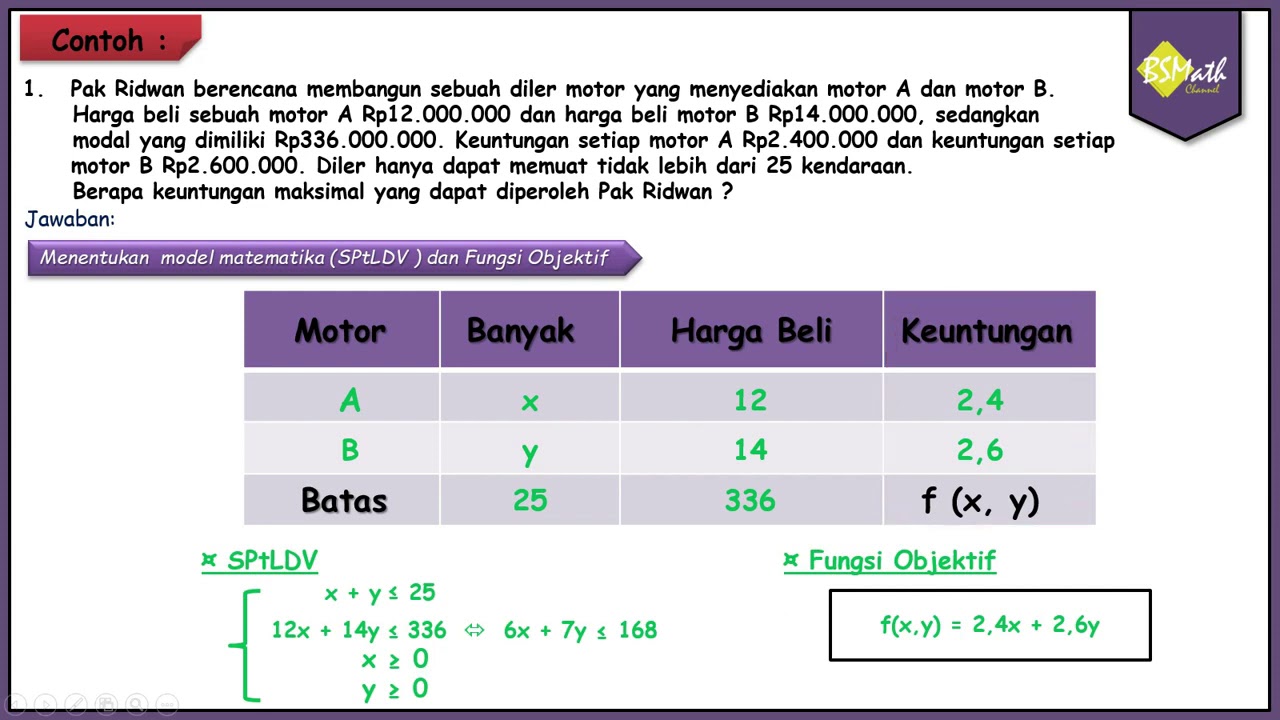
Menyelesaikan Permasalahan Program Linear Menentukan Nilai Optimum dengan Metode Uji Titik Pojok

Metode Statistika | Analisis Regresi Linier | Part 1 Menentukan Persamaan Regresi
5.0 / 5 (0 votes)