Extreme Heatwave in India | Why 2024 is the Hottest Year? | Dhruv Rathee
Summary
TLDRThe video script discusses the alarming increase in global temperatures, highlighting record-breaking heatwaves in recent years. It attributes these phenomena to global warming, climate change, and natural cycles like El Niño. The script further explains the impact of El Niño on weather patterns, introduces the Urban Heat Island Effect, and suggests solutions such as greener cities, radiant cooling, and natural ventilation to combat rising temperatures.
Takeaways
- 🌡️ Record-breaking temperatures have been observed globally, with 2024 seeing the hottest months in recorded history.
- 🔥 The summer of 2023 was identified as the hottest in the last 2,000 years in the northern hemisphere due to extreme heat.
- 🌍 Global warming and climate change are cited as primary reasons for the extreme heat, but not the sole contributors.
- 🌊 El Niño, a natural climate cycle, has been intensifying due to climate change, causing severe weather events like floods and droughts.
- 🌞 The El Niño Southern Oscillation (ENSO) is the second most significant factor influencing Earth's climate after the Earth-Sun relationship.
- 🌧️ El Niño leads to hotter and drier conditions in Australia and Southeast Asia, while increasing rainfall in South America.
- 🔴 The opposite phenomenon, La Niña, causes increased rainfall in Australia and drier conditions in South America.
- ☀️ The Urban Heat Island Effect contributes to higher temperatures in city areas due to the absorption of sunlight by concrete and asphalt.
- 🌳 Solutions to mitigate heat waves include increasing green spaces, improving building ventilation, and using radiant cooling technologies.
- 🌡️ The Heat Index is a crucial metric that combines temperature and humidity to indicate how hot it feels, which can be higher than the actual temperature.
- 🌍 Future projections suggest that heat waves will become more frequent and longer-lasting, impacting the livability of cities and regions.
Q & A
What was the significance of the summer season in 2022 according to the article mentioned in the script?
-The summer season in 2022 was significant because it was referred to as the hottest summer ever, breaking a 122-year-old record in India.
How did the summer of 2023 compare to the previous years in terms of temperature?
-The summer of 2023 was even more extreme, with scientists stating that it was the hottest summer in the last 2,000 years in the northern hemisphere of Earth.
What unusual records were set in the first four months of 2024 according to the script?
-The first four months of 2024 each set records for being the hottest ever recorded for their respective months: January, February, March, and April.
Why were there forest fires in Uttarakhand and other states in India during the first week of May?
-The forest fires were a result of the extreme heat and heat wave conditions that were being experienced in those regions.
What is the primary cause behind the extreme weather events discussed in the script?
-Global warming and climate change are the primary causes behind the extreme weather events, but the script also mentions El Niño as a significant contributing factor.
What is El Niño and how does it affect the world's climate?
-El Niño is a natural climate cycle that occurs every 5-7 years, characterized by a warming of the Pacific Ocean. It affects the world's climate by causing more extreme weather patterns, such as droughts, floods, and heat waves.
What is the opposite phenomenon of El Niño called, and what are its effects?
-The opposite phenomenon of El Niño is called La Niña. It is characterized by stronger trade winds and colder water moving towards South America, leading to increased rainfall in Australia and drier conditions in South America.
How does the Urban Heat Island Effect contribute to higher temperatures in cities?
-The Urban Heat Island Effect occurs when urban areas with concrete, asphalt, and tall buildings absorb and retain heat, leading to higher temperatures than in areas with more greenery and natural ventilation.
What are some of the solutions proposed in the script to mitigate the effects of heat waves and the Urban Heat Island Effect?
-The script suggests solutions such as planting more trees, promoting public transport, using natural cooling methods like ventilation and radiant cooling, painting roofs white to reflect sunlight, and reducing the use of air conditioners.
What is the Heat Index and why is it important in assessing the impact of heat waves?
-The Heat Index is a metric that combines both temperature and humidity to indicate how hot the weather feels. It is important because it provides a more accurate representation of the heat's impact on the human body compared to temperature alone.
How does the script describe the potential future of heat waves based on the 'Future Projections for the Tropical Indian Ocean' study?
-According to the study mentioned in the script, by 2050, many areas may experience heat waves lasting for 220 to 250 days a year, indicating a significant increase in the frequency and duration of such extreme weather events.
Outlines

This section is available to paid users only. Please upgrade to access this part.
Upgrade NowMindmap

This section is available to paid users only. Please upgrade to access this part.
Upgrade NowKeywords

This section is available to paid users only. Please upgrade to access this part.
Upgrade NowHighlights

This section is available to paid users only. Please upgrade to access this part.
Upgrade NowTranscripts

This section is available to paid users only. Please upgrade to access this part.
Upgrade NowBrowse More Related Video
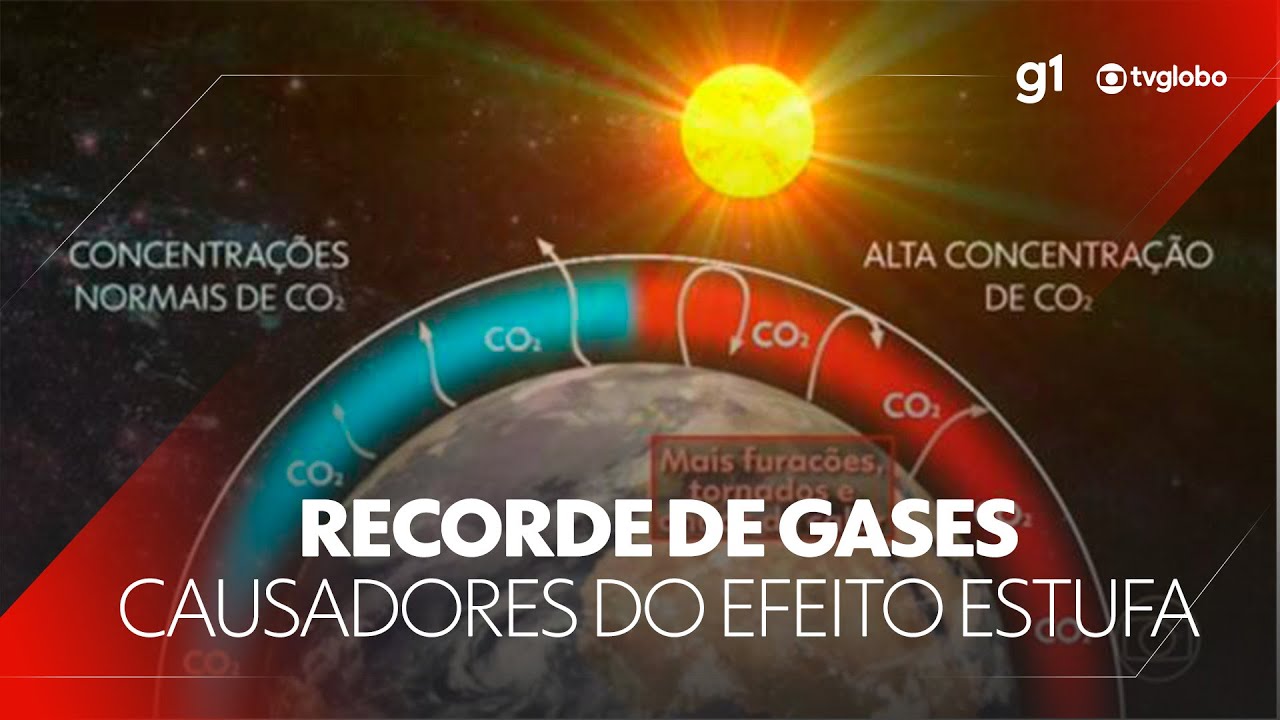
ONU alerta para recorde na concentração de gases causadores do efeito estufa na atmosfera #g1 #JN

Bisakah Kita Menghentikan Pemanasan Global?

Overview of Heat-Related Illnesses | NEJM
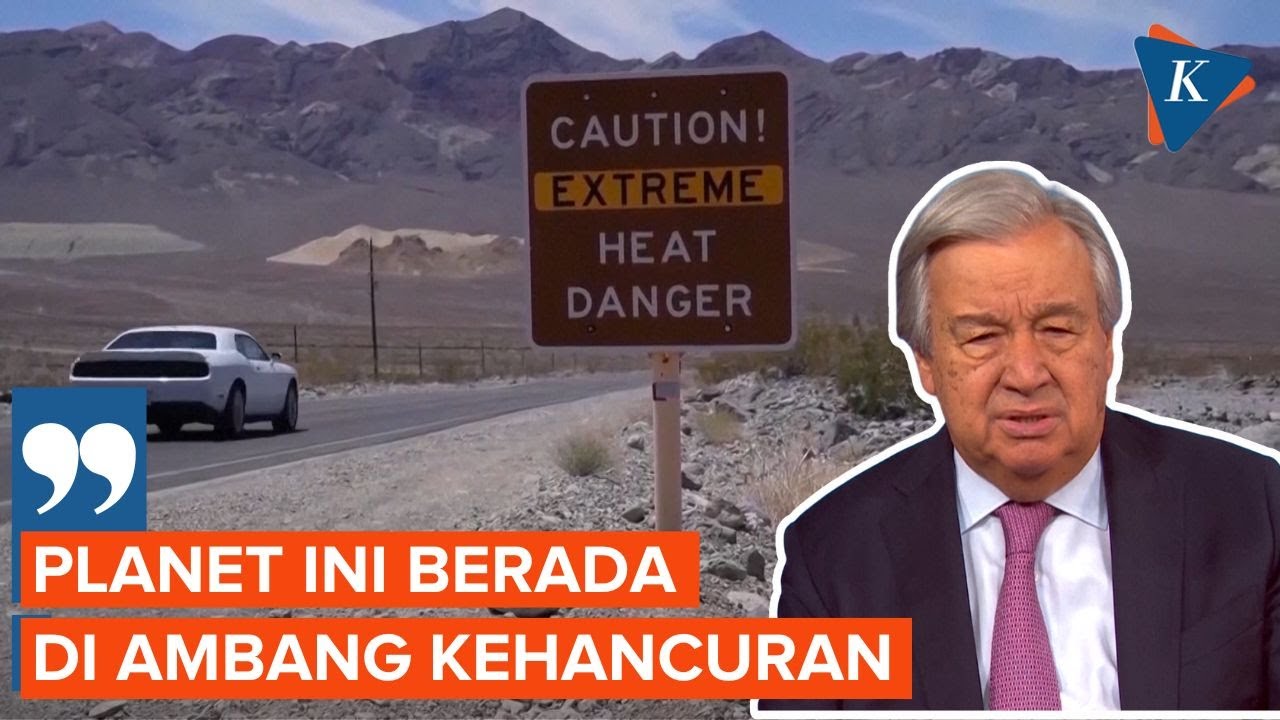
Laporan Iklim Global Tunjukkan Bumi Berada di Ambang Kehancuran
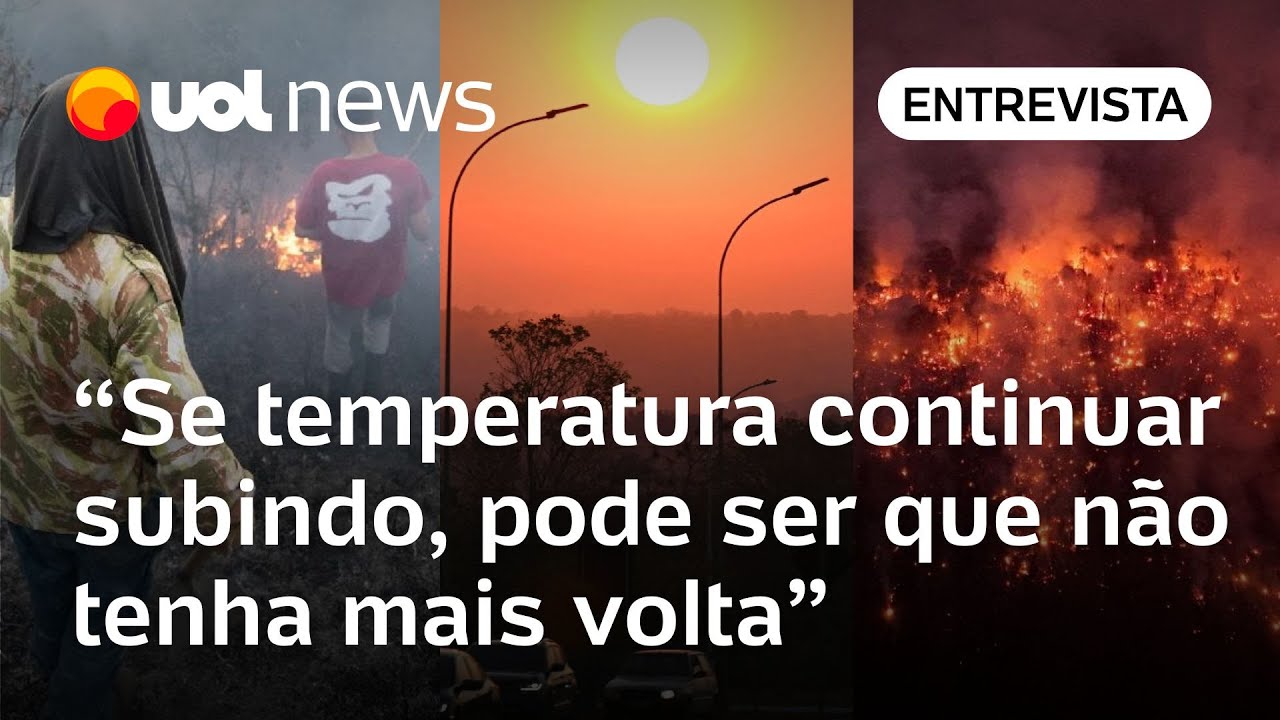
Fim da Amazônia, extinção dos recifes de corais: o futuro do Brasil superaquecido | Carlos Nobre

Climate Change
5.0 / 5 (0 votes)