Uji Normalitas Shapiro Wilk Dengan SPSS
Summary
TLDRThis video provides a detailed step-by-step guide on performing the Saphiro-Wilk normality test using SPSS for small sample sizes. It covers data preparation in Microsoft Excel, setting up variables in SPSS, and performing the test for two research variables—promotion and sales. The tutorial explains the decision-making process based on significance values, highlighting when the data is normally distributed. The video also touches on Kolmogorov-Smirnov tests and provides tips for interpreting results. The presenter offers clear instructions aimed at helping users understand and execute the normality test with ease.
Takeaways
- 😀 Understand the concept of the Shapiro-Wilk normality test, which is used to determine if research data is normally distributed.
- 😀 The normality test is essential for independent sample t-tests, where a normal distribution is required for valid results.
- 😀 The Shapiro-Wilk test is most commonly used for small sample sizes (less than 30).
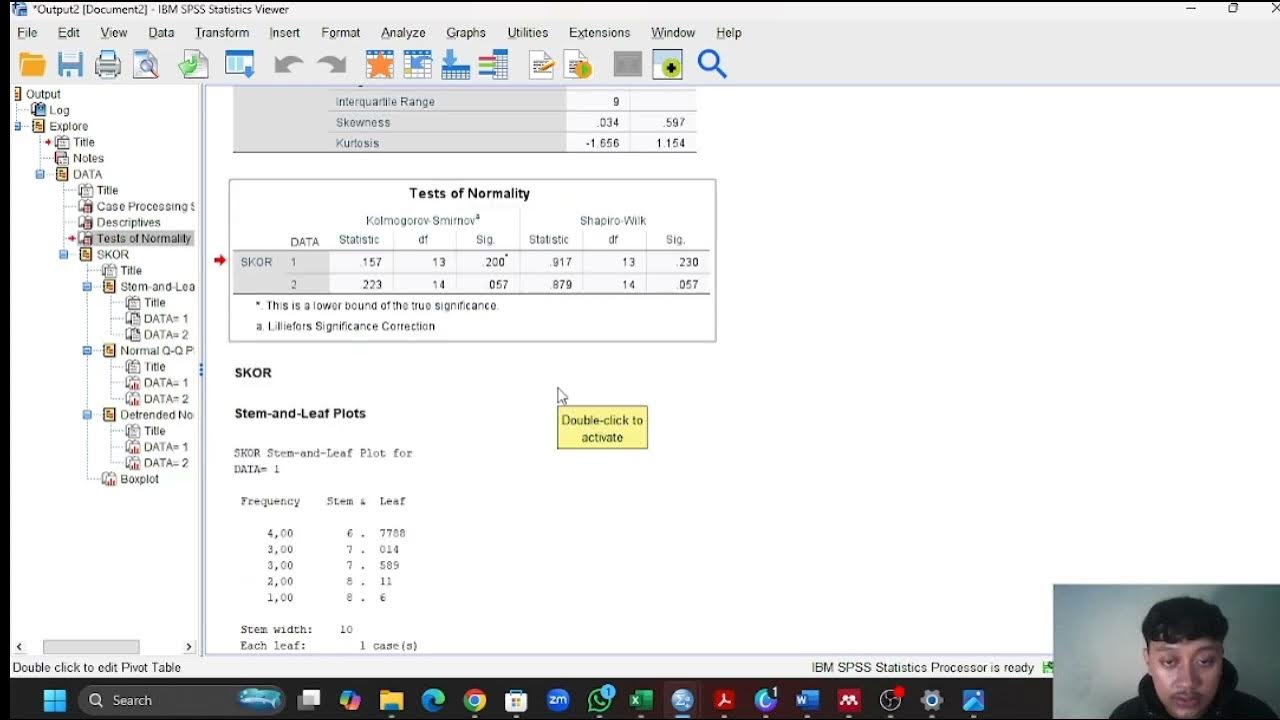
- 😀 If the significance value (p-value) is greater than 0.05, the data is considered to be normally distributed.
- 😀 If the significance value is less than 0.05, the data is not considered to be normally distributed.
- 😀 For the analysis, ensure the data is copied from Excel and pasted into SPSS for further analysis.
- 😀 Set the variable names in SPSS as X (for promotion) and Y (for sales), and ensure the decimal places are set to 0.
- 😀 During the analysis in SPSS, select 'Explore' under descriptive statistics to run the normality test.
- 😀 Make sure the 'Normality Plots with Tests' option is checked in SPSS to generate the normality plots along with the test results.
- 😀 After running the test, check the significance value from the output to decide if the data is normally distributed.
- 😀 For Kolmogorov-Smirnov test results, if the 'a' above the value is displayed, it refers to a corrected result, indicating a Liliefors test, which should be interpreted similarly to the Shapiro-Wilk test.
Q & A
What is the main purpose of the Saphiro-Wilk normality test in the context of this script?
-The main purpose of the Saphiro-Wilk normality test, as discussed in the script, is to determine whether the research data follows a normal distribution. This test is important for ensuring the assumptions of parametric tests like the Independent Samples T-Test are met.
Why is the Saphiro-Wilk test specifically used for small sample sizes?
-The Saphiro-Wilk test is commonly used for small sample sizes (typically less than 30) because it is more reliable than other normality tests when dealing with fewer data points. Small samples are more prone to violations of normality, so this test helps assess the distribution of the data more accurately.
What are the steps to conduct the normality test using SPSS, according to the script?
-To conduct the normality test using SPSS, the script outlines several steps: First, enter the data into SPSS from Excel. Then, define the variables and set up the dataset with the correct labels. Next, use the 'Descriptive Statistics' function, select 'Explore', and input the dependent variables. Finally, set the significance level, select the plot options for normality, and run the test.
What does the significance level (alpha) represent in the normality test?
-In the context of the normality test, the significance level (alpha) represents the threshold used to determine whether the data is normally distributed. If the significance value is greater than alpha (typically 0.05), the data is considered to be normally distributed. If it's lower, the data is not normal.
How should one interpret the results from the Saphiro-Wilk normality test based on the script?
-If the significance value (p-value) is greater than 0.05, it indicates that the data follows a normal distribution. In the script’s example, both the promotion and sales variables have p-values of 0.577 and 0.945, which are both above 0.05, suggesting that the data is normally distributed.
What is the difference between the Kolmogorov-Smirnov test and the Saphiro-Wilk test mentioned in the script?
-The Kolmogorov-Smirnov test is another method for assessing normality, but in the script, it's noted that when using SPSS, the Kolmogorov-Smirnov result is corrected to a Lilliefors significance correction. This corrected version is essentially a more accurate normality test for small sample sizes.
What is the role of the 'normality plots' in the normality test procedure?
-The 'normality plots' are used to visually inspect the distribution of the data. In the script, the 'normality plot' option is selected along with the statistical test to provide a graphical representation of the data's distribution, which complements the statistical results and helps in interpreting normality.
How does the script suggest handling situations where the significance value is lower than 0.05?
-If the significance value is lower than 0.05, it suggests that the data does not follow a normal distribution. In such cases, the researcher may consider using non-parametric tests instead of parametric ones like the Independent Samples T-Test.
Why is it important to set the decimal places to '0' in SPSS, as mentioned in the script?
-Setting the decimal places to '0' in SPSS is important because the data used in this example consists of whole numbers, not decimals. This ensures that the data is presented correctly and avoids confusion in the analysis process.
What does the term 'dependent variable' refer to in the context of the script?
-In the script, the dependent variable refers to the variable that is being measured or predicted in the study. In this case, 'sales' is the dependent variable (y), while 'promotion' is the independent variable (x).
Outlines

This section is available to paid users only. Please upgrade to access this part.
Upgrade NowMindmap

This section is available to paid users only. Please upgrade to access this part.
Upgrade NowKeywords

This section is available to paid users only. Please upgrade to access this part.
Upgrade NowHighlights

This section is available to paid users only. Please upgrade to access this part.
Upgrade NowTranscripts

This section is available to paid users only. Please upgrade to access this part.
Upgrade NowBrowse More Related Video

Cara Uji Normalitas dan Homogenitas Menggunakan SPSS dengan Mudah

Shapiro Wilk in SPSS

#2- UJI NORMALITAS DATA KELAS EKSPERIMEN DAN KELAS KONTROL MENGGUNAKAN SPSS

Pertemuan 6 Uji Mean One Sample T-Test
Tutorial Mengerjakan Uji Normality Statistika di SPSS

Cara Uji Asumsi Klasik: Normalitas, Multikolinearitas dan Heteroskedastisitas Menggunakan SPSS
5.0 / 5 (0 votes)