Pertemuan 6 Uji Mean One Sample T-Test
Summary
TLDRThis tutorial demonstrates how to perform a One-Sample T-Test using SPSS, guiding viewers through the process of checking data normality and hypothesis testing. The One-Sample T-Test compares a sample mean to a population mean (e.g., 75). It begins with normality testing using the Shapiro-Wilk test, followed by executing the T-Test in SPSS. The outcome is interpreted using the significance value: if p < 0.05, the null hypothesis is rejected, indicating a significant difference in means. This video is ideal for students and researchers learning to apply these statistical methods.
Takeaways
- 😀 The One-Sample T-Test is used to compare the sample mean with a known population mean, often in hypothesis testing.
- 😀 The assumption of normality is crucial before performing a One-Sample T-Test. The data must be normally distributed for the test to be valid.
- 😀 To check normality, use SPSS's descriptive statistics tools and the Shapiro-Wilk test for normality.
- 😀 If the p-value from the normality test (Shapiro-Wilk) is greater than 0.05, the data is considered normally distributed.
- 😀 Once normality is confirmed, proceed with the One-Sample T-Test by selecting **Analyze** > **Compare Means** > **One-Sample T-Test** in SPSS.
- 😀 The **Test Value** in the One-Sample T-Test is the population mean you are comparing your sample to (e.g., 75).
- 😀 A p-value from the One-Sample T-Test smaller than 0.05 indicates a significant difference between the sample mean and the population mean, leading to rejection of the null hypothesis.
- 😀 A p-value greater than 0.05 means there is no significant difference between the sample mean and the population mean, and the null hypothesis is not rejected.
- 😀 Descriptive statistics output in SPSS includes the sample size, mean, standard deviation, and standard error of the mean, which provide insights into the data's distribution.
- 😀 The One-Sample T-Test in SPSS is a straightforward statistical test, ideal for comparing a sample mean to a known value or population mean.
Q & A
What is the main focus of the tutorial in the transcript?
-The main focus of the tutorial is to demonstrate how to conduct a One-Sample T-test using SPSS, particularly in the context of comparing sample means to a population mean.
What is the purpose of a One-Sample T-test in research?
-A One-Sample T-test is used to compare the mean of a sample to a known population mean to determine if there is a significant difference between them.
What type of data is suitable for performing a One-Sample T-test?
-A One-Sample T-test is suitable for interval or ratio data, as it is part of parametric statistics and requires the assumption of normal data distribution.
Why is normality testing important before conducting a One-Sample T-test?
-Normality testing is important because a One-Sample T-test assumes that the data is normally distributed. If the data does not meet this assumption, the results of the test may not be valid.
How can normality of data be tested in SPSS according to the transcript?
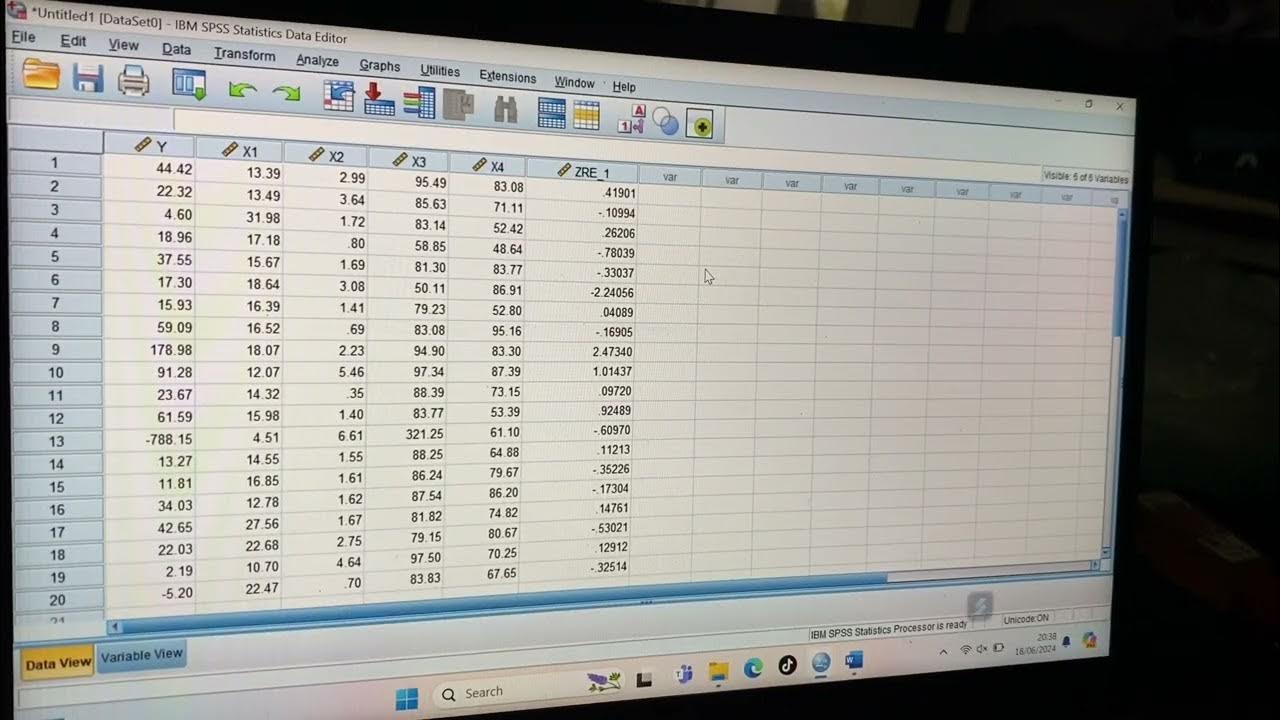
-In SPSS, normality can be tested by going to 'Analyze', selecting 'Descriptive Statistics', and then choosing 'Explore'. In the 'Plots' section, the 'Normality plots with tests' option should be checked.
What is the significance of the value 0.05 in normality testing?
-A p-value greater than 0.05 in a normality test indicates that the data is likely normally distributed, as the null hypothesis (that the data is normal) cannot be rejected.
What does a p-value of 0.365 in the normality test signify?
-A p-value of 0.365 in the normality test indicates that the data is normally distributed because it is greater than 0.05, meaning the null hypothesis that the data is normal is not rejected.
How do you perform the actual One-Sample T-test in SPSS as described in the tutorial?
-To perform the One-Sample T-test in SPSS, click 'Analyze', then 'Compare Means', and select 'One-Sample T-test'. You then move the variable of interest to the 'Test Variable(s)' section, set the test value (e.g., 75), and click 'OK'.
What decision rule is used to interpret the result of the One-Sample T-test?
-The decision rule is: if the p-value (significance) is less than 0.05, the null hypothesis (that the sample mean is equal to the population mean) is rejected, meaning the sample mean is significantly different from the population mean.
What was the result of the One-Sample T-test in the tutorial example?
-In the example, the p-value was 0.001, which is less than 0.05. Therefore, the null hypothesis was rejected, and it was concluded that the mean test score of the students was significantly different from the population mean of 75.
Outlines

This section is available to paid users only. Please upgrade to access this part.
Upgrade NowMindmap

This section is available to paid users only. Please upgrade to access this part.
Upgrade NowKeywords

This section is available to paid users only. Please upgrade to access this part.
Upgrade NowHighlights

This section is available to paid users only. Please upgrade to access this part.
Upgrade NowTranscripts

This section is available to paid users only. Please upgrade to access this part.
Upgrade Now5.0 / 5 (0 votes)


