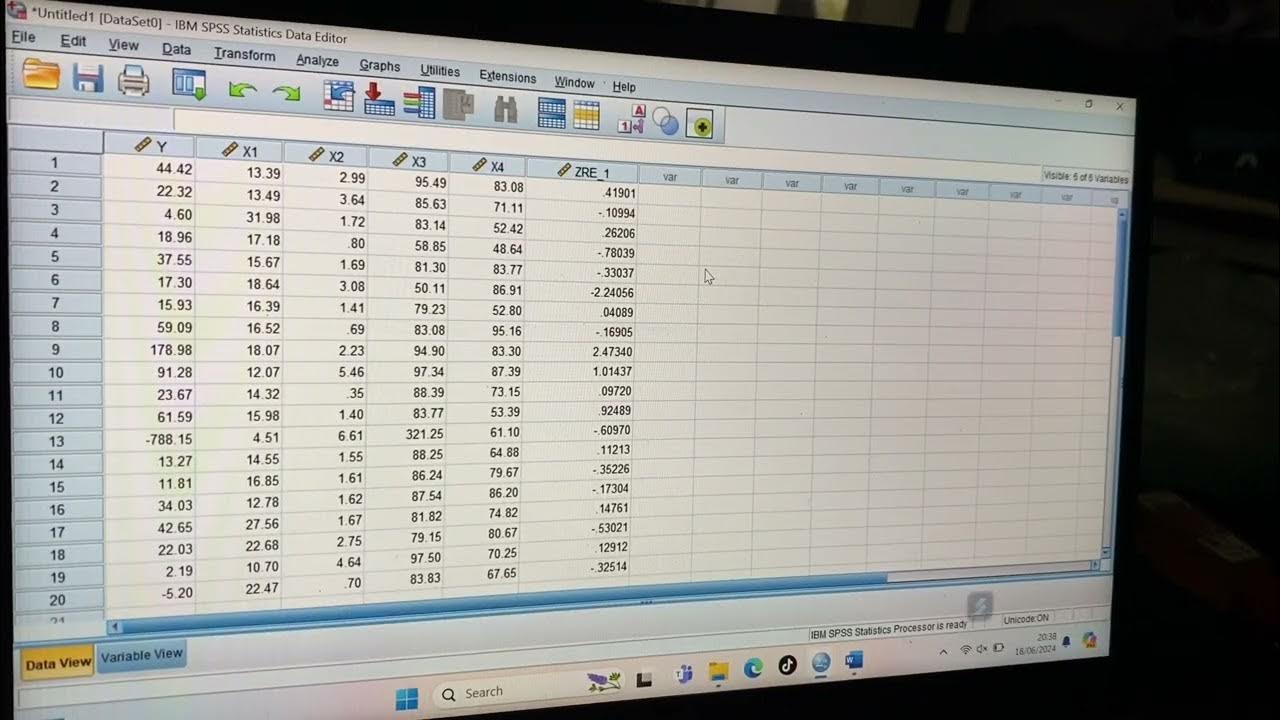
#2- UJI NORMALITAS DATA KELAS EKSPERIMEN DAN KELAS KONTROL MENGGUNAKAN SPSS
Summary
TLDRIn this tutorial, the presenter demonstrates how to perform normality testing on research data using SPSS software, specifically comparing experimental and control class data. The focus is on understanding whether the data follows a normal distribution, which is crucial before conducting parametric tests like paired sample t-tests or independent sample t-tests. If the data is not normally distributed, non-parametric tests like Wilcoxon or Mann-Whitney are used. The video provides a step-by-step guide, explaining the normality tests (Kolmogorov-Smirnov and Shapiro-Wilk) and how to input data into SPSS for analysis. The video concludes with a practical example and troubleshooting tips.
Takeaways
- 😀 Normality testing is a crucial step to determine if research data is normally distributed before performing parametric statistical analysis.
- 😀 The Kolmogorov-Smirnov and Shapiro-Wilk tests are the two main normality tests demonstrated in the video for SPSS analysis.
- 😀 If the p-value of the normality tests is less than 0.05, it indicates that the data does not follow a normal distribution.
- 😀 If data is not normally distributed, non-parametric tests such as Wilcoxon and Mann-Whitney are recommended for analysis.
- 😀 Descriptive statistics, including normality testing, can be accessed through the 'Analyze' and 'Explore' functions in SPSS.
- 😀 The tutorial demonstrates how to input data for both experimental (small group discussion method) and control groups (conventional method).
- 😀 It's important to code the data properly for each group, such as labeling variables for pretests, posttests, and identifying control and experimental groups.
- 😀 The SPSS output includes both Kolmogorov-Smirnov and Shapiro-Wilk test results, allowing users to assess normality for each variable.
- 😀 If the data does not pass the normality test, researchers must shift to non-parametric tests to ensure accurate statistical analysis.
- 😀 The video encourages sharing the tutorial for others who may benefit, and provides a space for feedback to correct any mistakes in the tutorial process.
Q & A
What is the main purpose of this tutorial?
-The main purpose of this tutorial is to guide viewers through performing a normality test using SPSS for data analysis in an experiment involving experimental and control groups.
What are the two groups involved in the study?
-The two groups involved are the experimental group, which uses the Small Group Discussion method, and the control group, which uses the conventional teaching method.
Why is normality testing important in statistical analysis?
-Normality testing is essential to determine if the data follows a normal distribution, which is a requirement before conducting parametric statistical tests like the paired sample t-test or independent sample t-test.
What are the two common normality tests used in SPSS?
-The two common normality tests in SPSS are the Kolmogorov-Smirnov test and the Shapiro-Wilk test.
What does it indicate if the significance value is less than 0.05 in normality tests?
-If the significance value is less than 0.05, it indicates that the data does not follow a normal distribution.
What should you do if your data is not normally distributed?
-If the data is not normally distributed, you should use non-parametric statistical tests, such as the Wilcoxon test and Mann-Whitney test, for further analysis.
How does the SPSS process for normality testing work in this tutorial?
-In SPSS, after entering the data, you go to the 'Analyze' menu, select 'Descriptive Statistics', and then 'Explore'. You choose the variables for analysis and check the box for 'Normality plots with tests'. Finally, the output is generated showing the results of the normality tests.
What does the 'Explore' function in SPSS help with in this context?
-'Explore' in SPSS helps to generate descriptive statistics and provides a platform for conducting normality tests, allowing you to assess whether the data is normally distributed.
What are the variables involved in the study?
-The variables involved are the pretest, process, and posttest scores for both the experimental group (using the Small Group Discussion method) and the control group (using the conventional teaching method).
How is the data organized in SPSS for this analysis?
-In SPSS, the data is organized with variables for each group, including pretest, posttest, and process scores for both the experimental and control groups. Each entry is assigned a code representing the class (experimental or control).
Outlines

This section is available to paid users only. Please upgrade to access this part.
Upgrade NowMindmap

This section is available to paid users only. Please upgrade to access this part.
Upgrade NowKeywords

This section is available to paid users only. Please upgrade to access this part.
Upgrade NowHighlights

This section is available to paid users only. Please upgrade to access this part.
Upgrade NowTranscripts

This section is available to paid users only. Please upgrade to access this part.
Upgrade NowBrowse More Related Video

Tutorial Menggunakan Spss untuk data Panel

Cara Uji Normalitas dan Homogenitas Menggunakan SPSS dengan Mudah

Uji t dan Uji F Lengkap dengan Penjelasanya Menggunakan SPSS

Pertemuan 6 Uji Mean One Sample T-Test

ANALISIS STATISTIK DESKRIPTIF (FREKUENSI DAN DESKRIPTIF) DENGAN SPSS

Uji Normalitas Menggunakan SPSS
5.0 / 5 (0 votes)