APA ITU KOEFISIEN DETERMINASI (r²) ? | CONTOH DAN PEMBAHASAN PADA OUTPUT SPSS #StudyWithTika
Summary
TLDRIn this video, Rizki Atika explains the concept of the coefficient of determination (R-squared) in multiple linear regression. The R-squared value represents the ability of independent variables to explain the variance in a dependent variable. The video also addresses the limitations of R-squared, such as its tendency to increase with the addition of more independent variables, even if they have no actual correlation with the dependent variable. To solve this, the adjusted R-squared is introduced as a better measure. Additionally, viewers are reminded that a negative R-squared value is treated as zero, indicating no explanatory power.
Takeaways
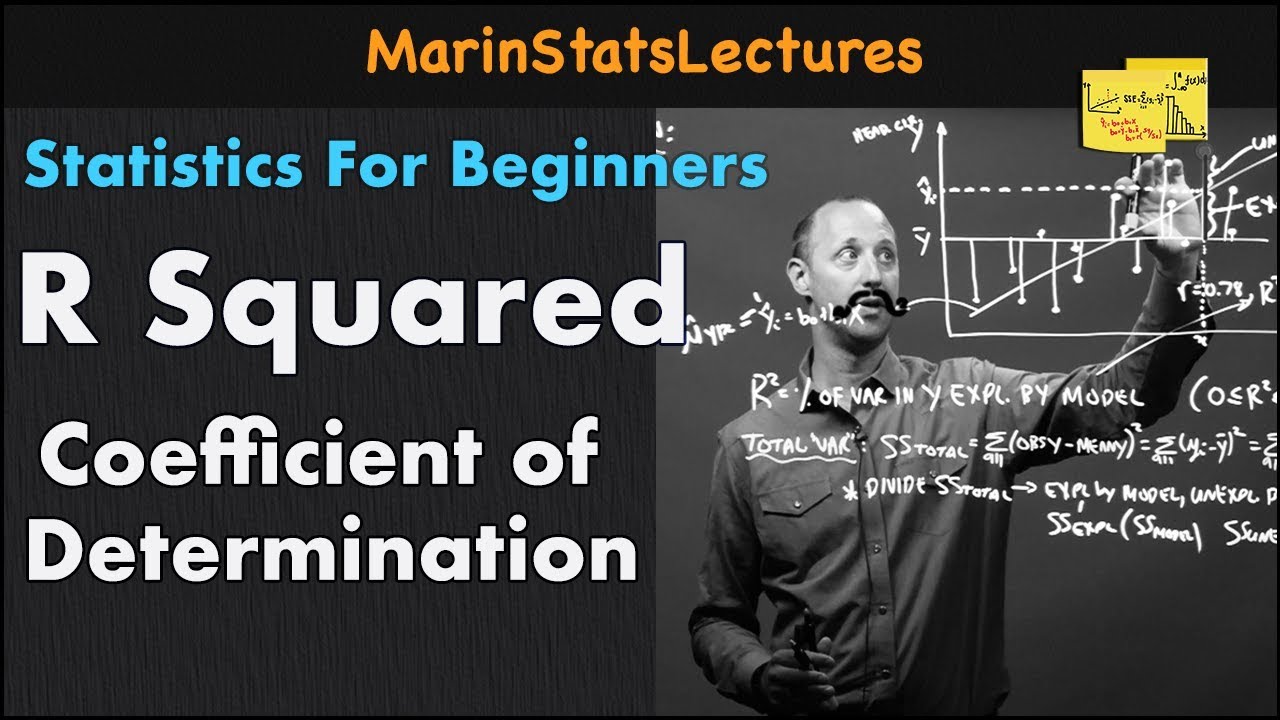
- 😀 The coefficient of determination (R-squared) measures how well independent variables explain the variance in the dependent variable in multiple linear regression.
- 😀 R-squared is the square of the correlation coefficient (R), and it ranges from 0 to 1. For example, an R value of 0.8 results in an R-squared of 0.64.
- 😀 R-squared indicates the proportion of variance in the dependent variable that can be explained by the independent variables in the model.
- 😀 A high R-squared value means that a large portion of the variance is explained by the model, while a lower R-squared indicates less explanatory power.
- 😀 Adding more independent variables to the model generally increases R-squared, even if the new variables do not have a meaningful relationship with the dependent variable.
- 😀 Adjusted R-squared is used to address the issue of R-squared increasing simply by adding more variables. It accounts for the number of variables and ensures only relevant ones improve the model.
- 😀 The main advantage of Adjusted R-squared is that it provides a more accurate measure of the model's explanatory power by considering the significance of each variable.
- 😀 If the R-squared value is negative, it indicates that the model is performing worse than a basic mean model, and such negative values are treated as zero.
- 😀 R-squared values close to 1 indicate a strong fit between the model and the data, but a high R-squared alone doesn't guarantee the model is appropriate.
- 😀 The video encourages viewers to watch related content, especially on the correlation coefficient, to fully understand the relationship between variables in regression analysis.
Q & A
What is the coefficient of determination in multiple linear regression?
-The coefficient of determination in multiple linear regression is a measure of how well all independent variables explain the variance in the dependent variable. It is often symbolized as R-squared (R²).
What does R-squared (R²) represent in regression analysis?
-R-squared represents the proportion of variance in the dependent variable that is explained by the independent variables in the model. A higher R² indicates better explanatory power of the model.
Why is it important to understand the correlation coefficient before discussing the coefficient of determination?
-It is important because the coefficient of determination is the square of the correlation coefficient. Understanding the correlation coefficient (r) helps explain how it leads to the R-squared value, which shows the strength of the relationship.
How is the coefficient of determination calculated from the correlation coefficient?
-The coefficient of determination (R²) is calculated by squaring the correlation coefficient (r). For example, if the correlation coefficient is 0.8, the R-squared value is 0.64 (0.8 * 0.8).
What does an R-squared value of 0.64 indicate?
-An R-squared value of 0.64 means that 64% of the variance in the dependent variable is explained by the independent variables in the model, while the remaining 36% is explained by factors outside the model.
What is the range of values for R-squared (R²)?
-R-squared values range from 0 to 1. A value of 1 means perfect explanatory power, while a value of 0 indicates no explanatory power.
What problem arises with R-squared when more independent variables are added to the model?
-The problem is that R-squared can increase with the addition of more independent variables, even if those variables do not have a meaningful relationship with the dependent variable, leading to potentially misleading conclusions.
Why is adjusted R-squared a better alternative than R-squared?
-Adjusted R-squared accounts for the number of independent variables in the model. It adjusts the R-squared value to reflect whether the added variables genuinely improve the model or not, preventing overestimation caused by simply adding more variables.
What does a negative R-squared value indicate?
-A negative R-squared value suggests that the model does not fit the data well and is no better than a model that simply predicts the mean of the dependent variable. In practice, negative R-squared values are interpreted as zero.
What is the importance of checking the correlation between independent variables and the dependent variable when using adjusted R-squared?
-When using adjusted R-squared, it is important to verify if the added independent variables genuinely correlate with the dependent variable. If they do not, the adjusted R-squared will not increase significantly, signaling that the variable addition was unnecessary.
Outlines

This section is available to paid users only. Please upgrade to access this part.
Upgrade NowMindmap

This section is available to paid users only. Please upgrade to access this part.
Upgrade NowKeywords

This section is available to paid users only. Please upgrade to access this part.
Upgrade NowHighlights

This section is available to paid users only. Please upgrade to access this part.
Upgrade NowTranscripts

This section is available to paid users only. Please upgrade to access this part.
Upgrade NowBrowse More Related Video
R Squared or Coefficient of Determination | Statistics Tutorial | MarinStatsLectures

APA ARTI NILAI KOEFISIEN KORELASI (r) PADA REGRESI LINIER BERGANDA ? | #StudyWithTika

Uji Regresi Linier Sederhana Dengan SPSS | Pembahasan Lengkap!
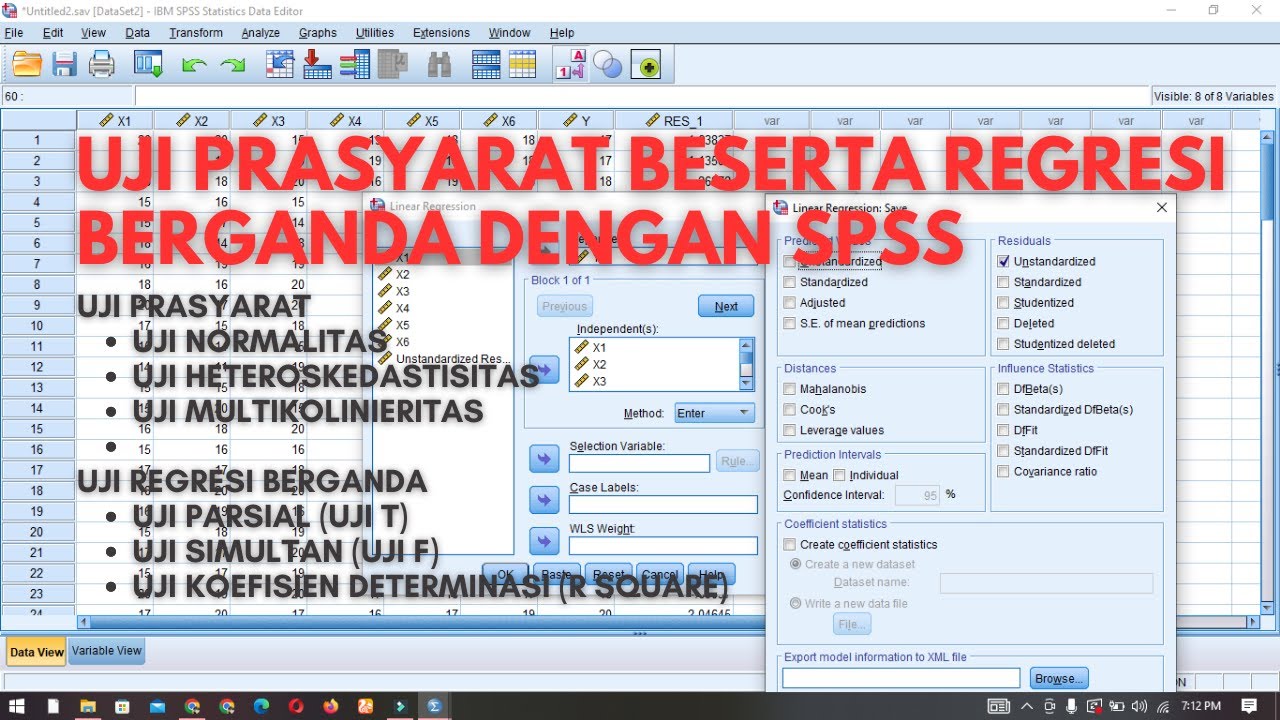
Tutorial Uji Asumsi Klasik (Prasyarat) Beserta Uji Regresi Berganda Dengan SPSS
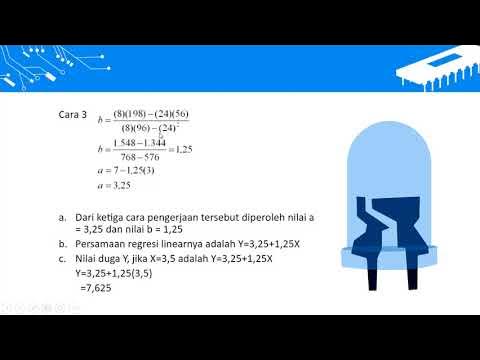
METODE NUMERIK 11 REGRESI LINIER

Uji t dan Uji F dalam Analisis Regresi Berganda dengan SPSS Lengkap
5.0 / 5 (0 votes)