Descriptive Statistics in Excel
Summary
TLDRThis tutorial walks through the steps of enabling Excel add-ins and performing descriptive statistics analysis. It guides viewers on how to activate the Analysis Toolpak, Analysis Toolpak VBA, and Solver add-ins, then demonstrates using the Data Analysis tool to calculate summary statistics for avocado sales data. The process includes selecting the input range, specifying output options, and interpreting the results, including mean, standard error, and mode, with a note on potential errors due to data variability.
Takeaways
- 📊 To perform descriptive statistics in Excel, you must first ensure that the Analysis Toolpak and other related add-ins are enabled.
- 🔍 Access the add-ins by going to 'File', then 'Options', and under 'Add-Ins', check the necessary tools like 'Analysis Toolpak' and 'Solver Add-in'.
- ✅ After enabling the add-ins, return to the data and navigate to the 'Data' tab to find the 'Data Analysis' feature.
- 📈 The 'Data Analysis' tool offers a variety of statistical analyses, including descriptive statistics.
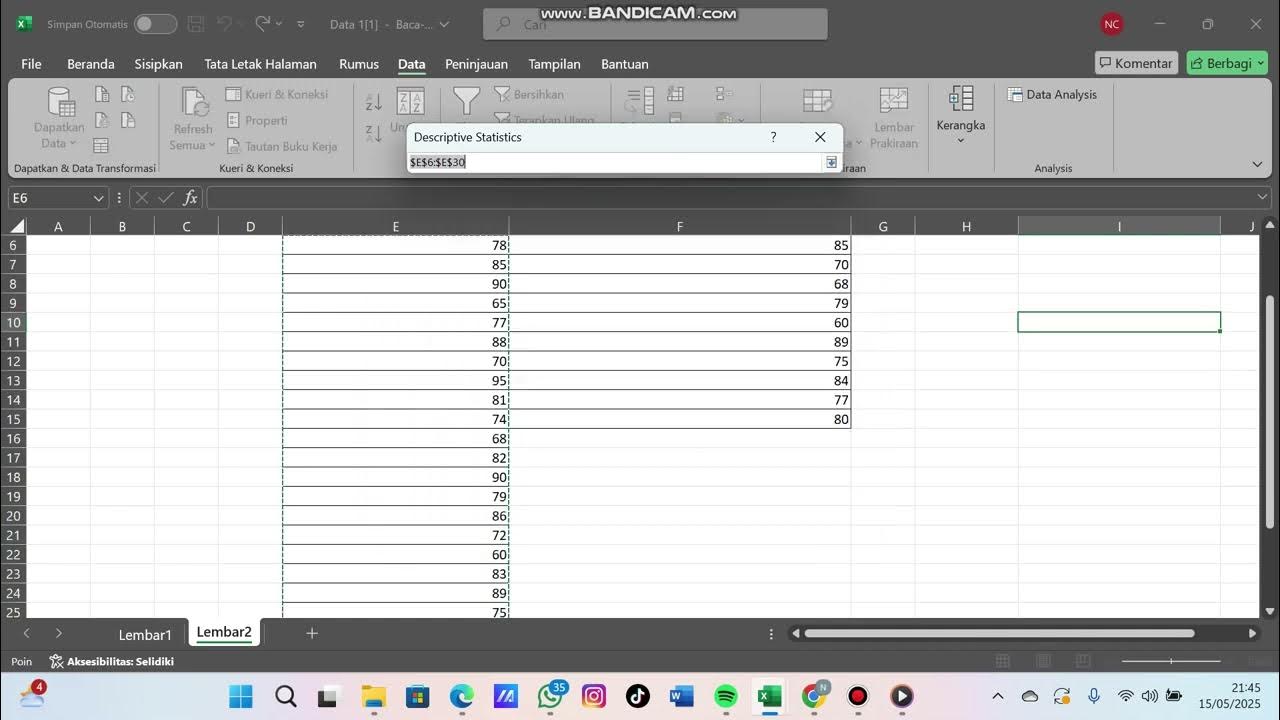
- 📝 When using 'Descriptive Statistics', you'll be prompted to select the input range of your data, such as the total volume of avocado sales.
- 🏷️ It's important to check the box if your data includes a label in the first row to ensure it's included in the analysis.
- 📊 Choose the type of output you want, such as 'Summary statistics', and set parameters like a 95% confidence level for the mean.
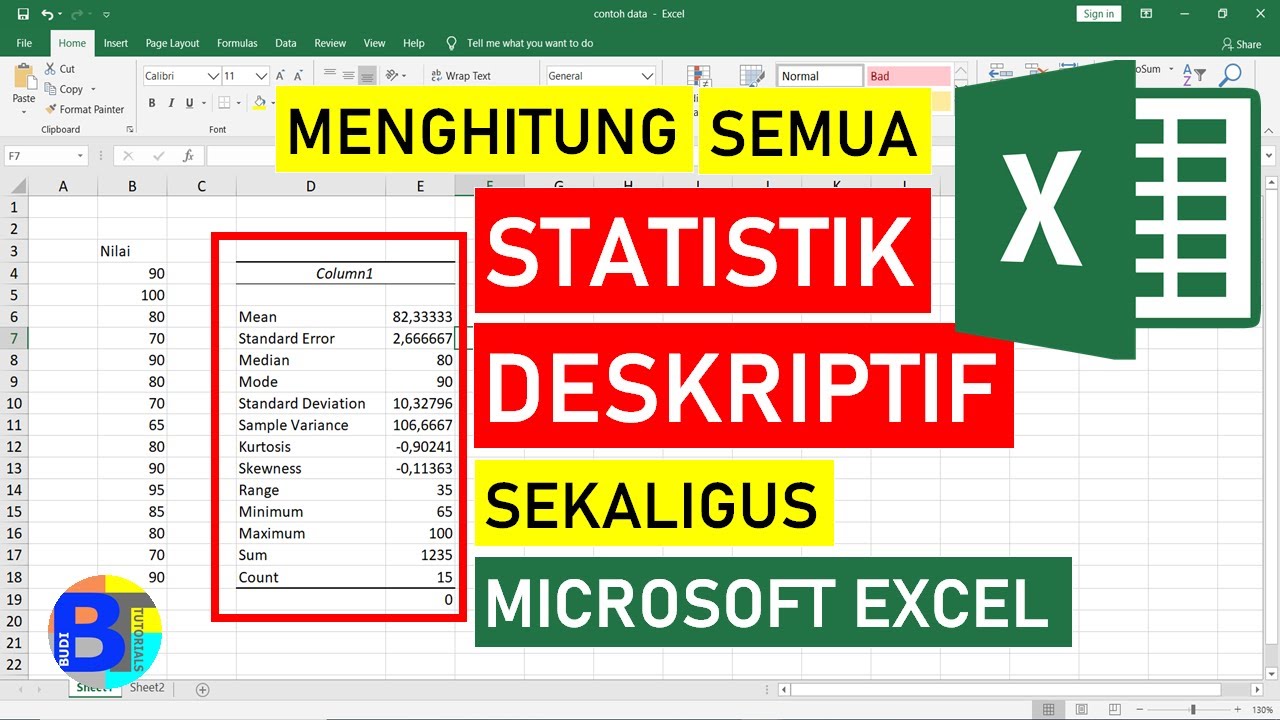
- 📝 The output will provide a range of descriptive statistics, including mean, standard deviation, and standard error.
- 🤔 Be aware that some statistics like 'mode' may not be calculable if no value in the dataset repeats, which is not an error but a reflection of data variability.
- 💡 Descriptive statistics in Excel is a straightforward process once you know the steps and how to use the tools provided.
- ❓ The script encourages viewers to ask questions in the comments if they have any, indicating an open invitation for further clarification or assistance.
Q & A
What is the first step to enable descriptive statistics in Excel?
-The first step is to ensure that the necessary add-ins are enabled. This is done by going to 'File', then 'Options', selecting 'Add-Ins', and checking the boxes for the Analysis Toolpak, Analysis Toolpak VBA, and Solver Add-in.
How do you access the descriptive statistics feature in Excel?
-After enabling the add-ins, you can access descriptive statistics by going to the 'Data' tab, then selecting 'Data Analysis' from the 'Analyze' section.
What are the three active application add-ins mentioned in the script?
-The three active application add-ins mentioned are the Analysis Toolpak, the Analysis Toolpak VBA, and the Solver Add-in.
What is the purpose of the 'Data Analysis' tool in Excel?
-The 'Data Analysis' tool allows users to perform various statistical analyses, including descriptive statistics, on their data.
What does the 'Descriptive Statistics' feature in Excel provide?
-The 'Descriptive Statistics' feature provides a range of statistical measures such as mean, standard deviation, standard error, and mode, giving a summary of the data's characteristics.
Why might the mode calculation result in an error in Excel?
-The mode calculation might result in an error if there is no value that occurs more than once in the dataset, indicating a lack of a mode due to the variability in the data.
What is the significance of selecting the 'Summary Statistics' option in the descriptive statistics feature?
-Selecting the 'Summary Statistics' option allows you to obtain a comprehensive overview of the dataset's central tendency, dispersion, and shape, which includes measures like mean, median, mode, standard deviation, and variance.
What is the purpose of specifying a 'Confidence Level' when using descriptive statistics in Excel?
-Specifying a 'Confidence Level', such as 95%, helps to estimate the range within which the true population mean is likely to fall, providing a measure of precision for the sample mean.
How do you select the input range for the descriptive statistics analysis in Excel?
-You select the input range by specifying the column or range of cells that contain the data you want to analyze, and checking the box if the first row contains labels.
What does the 'Output Range' refer to in the context of descriptive statistics in Excel?
-The 'Output Range' refers to the location on the spreadsheet where you want the results of the descriptive statistics analysis to be displayed.
Why is it important to check for errors after running descriptive statistics in Excel?
-Checking for errors is important to ensure the accuracy of the analysis. Errors, such as those in mode calculation, can indicate that certain statistics may not be applicable or meaningful for the given dataset.
Outlines

This section is available to paid users only. Please upgrade to access this part.
Upgrade NowMindmap

This section is available to paid users only. Please upgrade to access this part.
Upgrade NowKeywords

This section is available to paid users only. Please upgrade to access this part.
Upgrade NowHighlights

This section is available to paid users only. Please upgrade to access this part.
Upgrade NowTranscripts

This section is available to paid users only. Please upgrade to access this part.
Upgrade NowBrowse More Related Video
Cara Menghitung Statistik Deskriptif dengan Excel || Statistik Excel
Boxplot Satu Materi Part 2

MEMULAI SPSS: MEMBUAT VARIABLE, DATA ENTRY DAN NALISIS DATA DESKRIPTIF
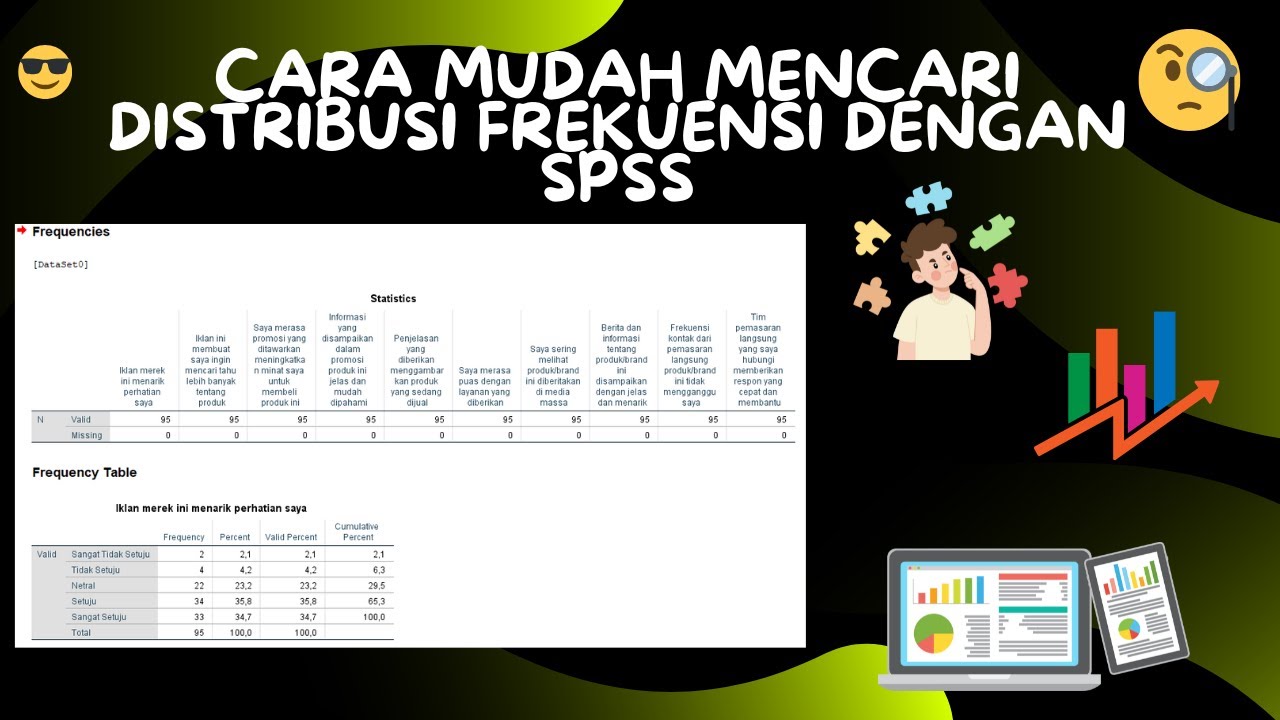
Cara Mudah Mencari Distribusi Frekuensi Dengan SPSS

🔴Cara Mengubah Data Ordinal ke Interval Dengan excel | Mengubah data ordinal ke interval dengan MSI
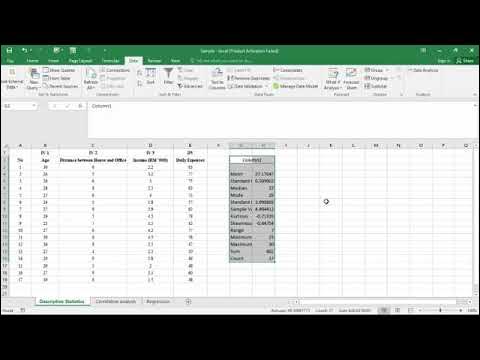
Descriptive Statistics, Correlation Analysis and Regression Analysis by Using Microsoft Excel
5.0 / 5 (0 votes)