Episode 8: Finding Market Makers Models (MMXM's) - ICT Concepts
Summary
TLDRThis trading tutorial delves into market maker models, explaining how to identify and understand MMX and MMBM patterns. It emphasizes the importance of original consolidation, accumulation, and distribution phases, and the significance of time frame alignment. The presenter illustrates concepts with chart examples, highlighting the difference between buy and sell models and the impact of smart money reversals on price movement. The goal is to recognize market maker strategies to make informed trading decisions.
Takeaways
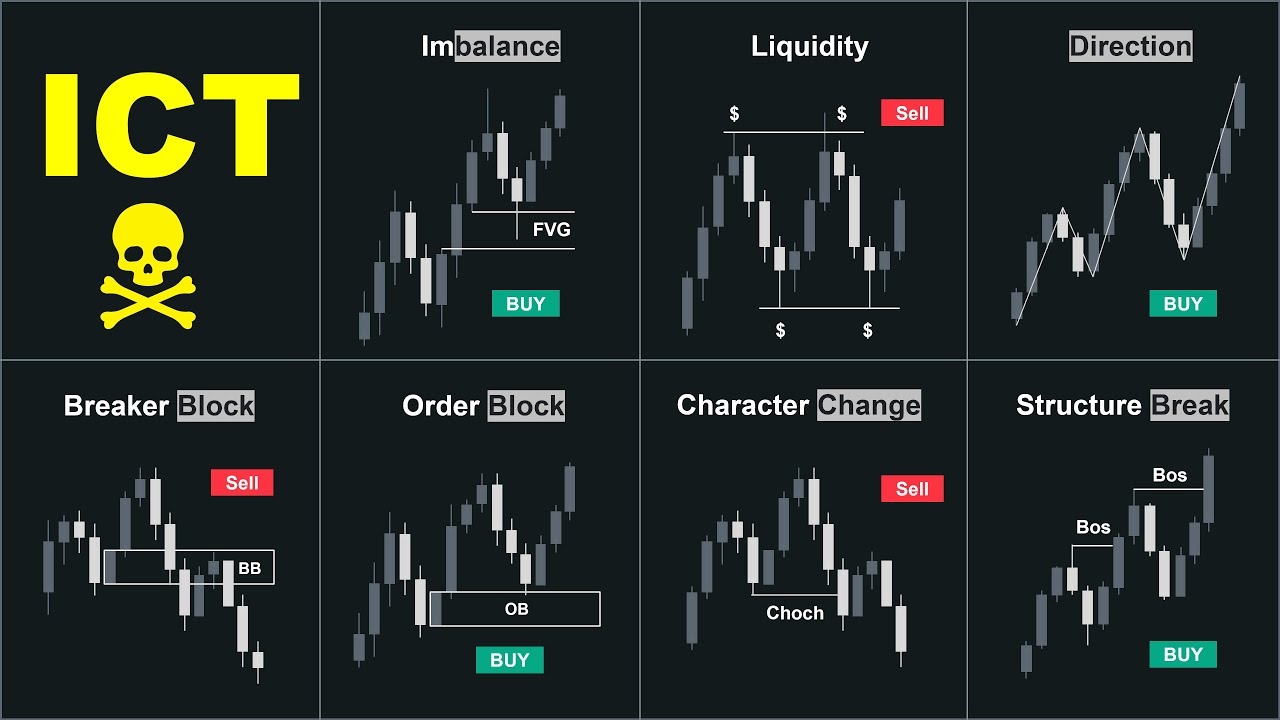
- 📈 Market Maker Models (MMX and MMBM/MMSM) are strategies to identify buy or sell patterns based on price action and time frame analysis.
- 🔍 Original consolidation is a prerequisite for identifying a market maker model; without it, the pattern is merely a regular draw on liquidity.
- 💡 In a Market Maker Buy Model (MMBM), down-closed candles should almost always support higher prices, indicating accumulation.
- 📉 Conversely, in a Market Maker Sell Model (MMSM), up-closed candles should support lower prices, indicating distribution.
- 🕰 Time frame alignments are crucial; reversals on lower time frames are retracements on higher time frames, and vice versa.
- 📊 Market Maker Buy Models involve accumulation phases on the buy side of the curve and distribution phases on the sell side.
- 📝 The script emphasizes the importance of understanding the difference between accumulation and distribution phases within market maker models.
- 🌐 Examples provided in the script illustrate how to identify market maker models using chart patterns and price action in various financial instruments like S&P 500 ES Futures.
- 📌 Fair value gaps and order blocks are significant in market maker models, indicating potential reversals and accumulation or distribution phases.
- 🔑 The script highlights the importance of trading on higher time frames to avoid confusion and to identify true market maker models effectively.
- 🚀 The final takeaway emphasizes the fractal nature of price, where understanding the relationship between different time frames can lead to better trading decisions.
Q & A
What is the primary focus of the 'Market Maker Models' module?
-The primary focus of the 'Market Maker Models' module is to provide an in-depth understanding of how to identify market maker models and explain what they are in the context of trading.
What does 'MMX' stand for in the context of the trading module?
-'MMX' stands for Market Maker X model, which is a specific type of market maker model that involves a retracement on a higher time frame and a reversal on a lower time frame.
What are the two main types of market maker models mentioned in the script?
-The two main types of market maker models mentioned are the Market Maker Buy Model (MMBM) and the Market Maker Sell Model (MMSM).
Why is the original consolidation important in identifying a market maker model?
-The original consolidation is important because all market maker models start with it. Without an original consolidation, the pattern is not identified as a market maker model but rather as a regular draw on liquidity or just a buy or sell side of the curve.
How do down closed candles behave in a Market Maker Buy Model?
-In a Market Maker Buy Model, down closed candles should almost always support the price higher, indicating an accumulation phase on the buy side of the curve.
What is the significance of time frame alignments in market maker models?
-Time frame alignments are significant because they help in understanding the relationship between different time frames and how reversals and retracements occur between them. Higher time frame reversals are retracements on lower time frames, and vice versa.
Can you explain the concept of 'order blocks' in the context of market maker models?
-Order blocks refer to areas where significant buying or selling pressure is observed, leading to price movements. In market maker models, these blocks can indicate accumulation or distribution phases and are crucial for understanding the market structure and potential future price movements.
What is the difference between an accumulation phase and a distribution phase in market maker models?
-An accumulation phase in a market maker model is when there is buying pressure, often occurring after a run on stops, preparing for an upward price movement. A distribution phase, on the other hand, is when selling pressure is present, often after a significant price increase, leading to a potential price decrease.
How does the concept of 'fair value gap' relate to market maker models?
-A 'fair value gap' is a price area that represents a significant change in the market structure. It can act as a draw for liquidity in market maker models, where the price is expected to move towards this gap after an internal or external liquidity event.
What is the importance of understanding higher time frames when trading market maker models?
-Understanding higher time frames is crucial when trading market maker models because it helps traders identify retracements and reversals that may not be apparent on lower time frames. This understanding can lead to better entry points and risk management in trading.
How can traders apply the knowledge of market maker models in real trading scenarios?
-Traders can apply the knowledge of market maker models to identify potential accumulation and distribution phases, understand the market structure, and make informed decisions about entry and exit points, as well as risk management strategies.
Outlines

This section is available to paid users only. Please upgrade to access this part.
Upgrade NowMindmap

This section is available to paid users only. Please upgrade to access this part.
Upgrade NowKeywords

This section is available to paid users only. Please upgrade to access this part.
Upgrade NowHighlights

This section is available to paid users only. Please upgrade to access this part.
Upgrade NowTranscripts

This section is available to paid users only. Please upgrade to access this part.
Upgrade NowBrowse More Related Video


5.0 / 5 (0 votes)