SMT Divergence + ICT Market Maker Model Explained
Summary
TLDRThis video delves into the Market Maker Buy Model (MMBM) and the concept of SMT Divergence, showing how they can be applied together for better trading strategies. The MMBM involves price movements from consolidation to reversal, with a focus on smart money activity at key liquidity levels. SMT Divergence occurs when correlated assets break their usual correlation, providing a powerful confirmation tool for trading. The video walks through real trade examples and explains how combining these strategies can improve trade accuracy and timing, ultimately aiding traders in targeting buy-side liquidity effectively.
Takeaways
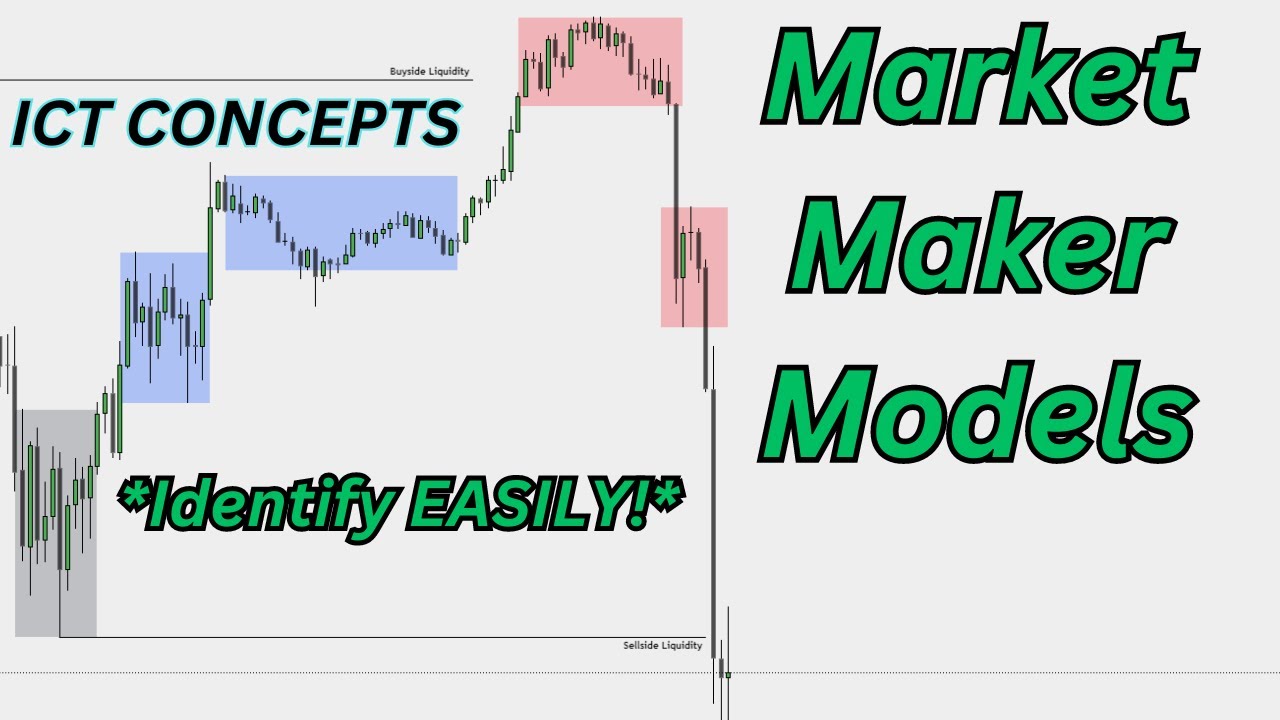
- 😀 The Market Maker Buy Model involves price moving through an original consolidation, followed by a sell-side movement, then a smart money reversal (SMR) at a higher timeframe liquidity level, and finally a move to the buy side of the curve.
- 😀 The primary objective of the buy side of the curve is to take out old highs that were created by smart money engineering, aiming to sell at higher prices with willing buyers, including retail traders' stop losses.
- 😀 SMT (Smart Money Theory) Divergence occurs when correlated assets, such as ES, NQ, and YM, deviate from their usual correlation, indicating potential market opportunities.
- 😀 In an SMT Divergence scenario, if one asset breaks correlation and makes a lower low while others make higher lows, it's a bullish setup, suggesting the weaker asset (NQ) will likely be slower to reach higher prices.
- 😀 The reverse of this, when one asset makes a higher high while others make lower highs, indicates bearish SMT Divergence, signaling that the weaker asset (NQ) will likely outperform the others to the downside.
- 😀 SMT Divergence can be used as additional confluence for trade setups, but it should not be used alone. Combining it with the market maker buy model logic increases the accuracy of trade decisions.
- 😀 The example trade in the video demonstrates using the market maker buy model and SMT Divergence, where a change in price delivery and a fair value gap signaled a smart money reversal, leading to a successful trade targeting buy-side liquidity.
- 😀 The strategy for identifying original consolidations includes looking for areas where price retraces, with the buy-side of the curve targeting liquidity above previous highs.
- 😀 The trade setup involved targeting short-term levels of liquidity on lower time frames, such as 5-minute consolidations, rather than holding positions for extended periods, which helps to simplify trade management.
- 😀 The presenter emphasizes the importance of using a higher timeframe point of decision (PD) or liquidity level as a guide for lower timeframe trades, helping to focus on key reversal points and avoid unnecessary drawdowns.
Q & A
What is the Market Maker Buy Model?
-The Market Maker Buy Model explains how the market moves from an original consolidation phase to the sell side of the curve, and then back to the buy side. Smart money manipulates the market to create liquidity, which is then targeted to take out the previous highs left behind during consolidation.
How does price move in the Market Maker Buy Model?
-Price first consolidates within a range, then moves away to the sell side of the curve. After creating a reversal point (Smart Money Reversal), it moves back to the buy side of the curve, targeting the liquidity above the previous highs formed during consolidation.
What is the significance of the Smart Money Reversal (SMR) in this model?
-The Smart Money Reversal (SMR) occurs when price hits a key level of liquidity or a price delivery area (PD), signaling that smart money has bought at lower levels. This sets up the price to move toward the buy side of the curve, aiming to take out previous highs.
What is SMT Divergence and how does it relate to correlated assets?
-SMT Divergence occurs when correlated assets (such as YM, ES, and NQ) fail to move together. For example, if NQ makes a lower low while ES and YM make higher lows, this is considered bullish SMT Divergence. It's an indication that the stronger assets (ES and YM) are likely to lead the market.
What are the key indicators to identify SMT Divergence?
-SMT Divergence is identified when one correlated asset (e.g., NQ) breaks the correlation by making a lower low or higher high, while the other assets (e.g., ES and YM) maintain the expected movement (higher lows or lower highs). This signals a shift in market dynamics.
How do you use SMT Divergence to inform trade decisions?
-When SMT Divergence is identified, the asset showing strength (such as ES or YM) is targeted for trades since it is more likely to move faster to its liquidity targets. The weaker asset (NQ) lags behind, making it less favorable for short-term trading.
How does the trader combine SMT Divergence with the Market Maker Buy Model?
-The trader uses SMT Divergence to confirm the strength of the market. For instance, if NQ shows weakness (making a lower low) while ES and YM show strength (making higher lows), the trader can focus on ES and YM for quicker upward movement, applying the Market Maker Buy Model to target liquidity above previous highs.
What is a typical example of a trade setup using the Market Maker Buy Model and SMT Divergence?
-A trade setup involves waiting for a Smart Money Reversal at a higher timeframe liquidity level, such as a fair value gap. Once the reversal occurs, the trader looks for SMT Divergence between NQ (weak) and ES/YM (strong). This helps confirm that ES/YM will move faster to the buy side of the curve, hitting liquidity targets sooner than NQ.
Why should SMT Divergence not be used in isolation?
-SMT Divergence alone offers low accuracy, as it only shows a correlation breakdown. For better results, it should be combined with other indicators, such as the Market Maker Buy Model, to provide additional confirmation and improve the reliability of trade setups.
How did the trader use SMT Divergence and Market Maker Buy Model on the S&P 500 example?
-In the S&P 500 example, the trader used SMT Divergence by noting that NQ was weaker, making a lower low, while ES and YM were stronger, making higher lows. This divergence confirmed that ES and YM were more likely to reach their liquidity targets first. The trader used this insight to target buy side liquidity on ES and YM, with the Market Maker Buy Model guiding the entry and exit points.
Outlines

This section is available to paid users only. Please upgrade to access this part.
Upgrade NowMindmap

This section is available to paid users only. Please upgrade to access this part.
Upgrade NowKeywords

This section is available to paid users only. Please upgrade to access this part.
Upgrade NowHighlights

This section is available to paid users only. Please upgrade to access this part.
Upgrade NowTranscripts

This section is available to paid users only. Please upgrade to access this part.
Upgrade NowBrowse More Related Video
Episode 8: Finding Market Makers Models (MMXM's) - ICT Concepts

Episode 7: Identifying Power Of 3 & SMT - ICT Concepts

Market Maker Models Explained | Step By Step Approach | ICT Concepts

How To Spot the Bottom of ICT's Market Maker Model

ICT Mentorship Core Content - Month 04 - Reclaimed ICT Orderblock

ICT Charter Price Action Model #4 Position Trading
5.0 / 5 (0 votes)