Ukuran Penyebaran Data Tunggal | Statistika Matematika Wajib Kelas 12 | Catatan Matematika @Bang-RP
Summary
TLDRIn this educational video, the host explains key statistical concepts related to single data sets, focusing on measures of data spread. The lesson covers range, interquartile range (IQR), quartile deviation, mean deviation, variance, and standard deviation with practical examples. Through step-by-step explanations and calculations, viewers learn to compute these statistical measures and understand their significance in analyzing data. The video emphasizes the importance of these concepts in data analysis and provides clear guidance on how to calculate each measure, making it accessible for beginners in statistics.
Takeaways
- 😀 The range of data (Jangkauan Data) is the difference between the largest (X_max) and the smallest (X_min) values in a dataset, calculated as J = X_max - X_min.
- 😀 The interquartile range (Hamparan Data) is the difference between the third quartile (Q3) and the first quartile (Q1), represented by H = Q3 - Q1.
- 😀 The quartile deviation (Simpangan Kuartil) is calculated as half of the interquartile range: QD = 1/2 * H.
- 😀 To find the range, the largest and smallest data points in a set are identified and subtracted.
- 😀 For the interquartile range, data must first be sorted in ascending order to identify Q1, Q2 (median), and Q3.
- 😀 The quartile deviation provides a measure of data spread by using the difference between Q3 and Q1.
- 😀 The mean deviation (Simpangan Rata-rata) calculates the average absolute distance between each data point and the mean, using the formula SR = (1/n) * Σ |X_i - X̄|.
- 😀 Variance (Ragam) measures the average of the squared differences from the mean, using the formula s² = (1/n) * Σ (X_i - X̄)².
- 😀 Standard deviation (Simpangan Baku) is the square root of the variance, providing a more interpretable measure of spread in the original units.
- 😀 In the example, after calculating the mean of the dataset, variance is found by squaring the differences between each data point and the mean, then averaging them.
- 😀 The standard deviation is derived by taking the square root of the variance, offering a sense of how spread out the data is in its original units.
Q & A
What is the range of a data set, and how is it calculated?
-The range is the difference between the largest and smallest data points in a set. It is calculated by subtracting the smallest value (Xmin) from the largest value (Xmax).
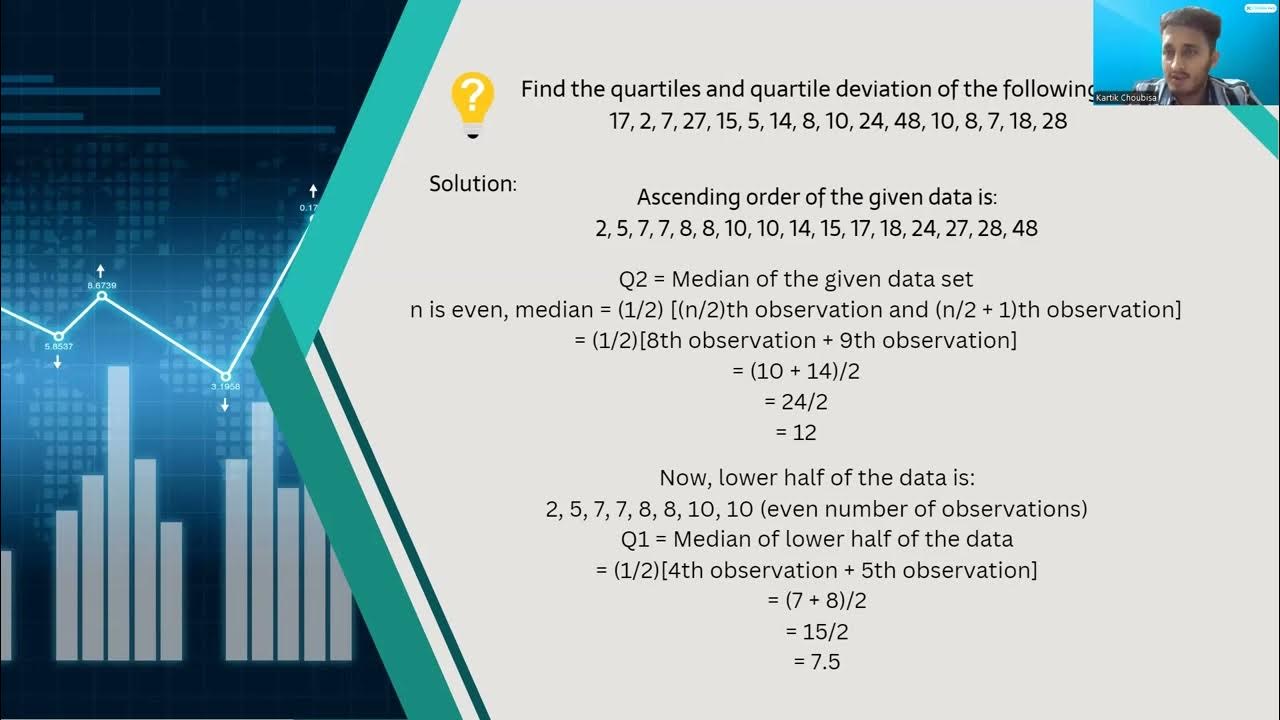
How do you calculate the interquartile range (IQR) of a data set?
-The interquartile range is calculated by subtracting the first quartile (Q1) from the third quartile (Q3). Q1 represents the median of the lower half of the data, while Q3 represents the median of the upper half.
What is the formula for quartile deviation (QD), and how is it related to the interquartile range?
-The quartile deviation is half of the interquartile range. The formula is QD = 1/2 * (Q3 - Q1), where Q3 is the third quartile and Q1 is the first quartile.
How do you calculate the mean deviation (MD) of a data set?
-The mean deviation is calculated by taking the average of the absolute differences between each data point and the mean of the data set. The formula is MD = (1/n) * Σ|Xi - X̄|, where Xi is each data point and X̄ is the mean.
What is variance, and how is it calculated?
-Variance measures the average squared deviation of each data point from the mean. The formula is s² = (1/n) * Σ(Xi - X̄)², where Xi represents each data point and X̄ is the mean.
How is the standard deviation related to variance, and how is it calculated?
-The standard deviation is the square root of the variance. Once the variance is calculated, the standard deviation is found by taking the square root of the variance value.
What does it mean when the standard deviation of a data set is small?
-A small standard deviation indicates that the data points are close to the mean, meaning there is little variation or spread in the data.
How is the median (Q2) of a data set determined?
-The median (Q2) is the middle value of a sorted data set. If the number of data points is odd, Q2 is the middle data point. If the number of data points is even, Q2 is the average of the two middle data points.
What is the difference between quartile 1 (Q1) and quartile 3 (Q3)?
-Q1 is the median of the lower half of the data, and Q3 is the median of the upper half. Together, Q1 and Q3 are used to calculate the interquartile range (IQR).
In the example data set 3, 5, 5, 4, 10, 9, 8, 7, 9, how is the range calculated?
-The range is calculated by subtracting the smallest value (3) from the largest value (10). Therefore, the range is 10 - 3 = 7.
Outlines

This section is available to paid users only. Please upgrade to access this part.
Upgrade NowMindmap

This section is available to paid users only. Please upgrade to access this part.
Upgrade NowKeywords

This section is available to paid users only. Please upgrade to access this part.
Upgrade NowHighlights

This section is available to paid users only. Please upgrade to access this part.
Upgrade NowTranscripts

This section is available to paid users only. Please upgrade to access this part.
Upgrade NowBrowse More Related Video
Statistika • Part 6: Contoh Soal Median, Kuartil, Desil, Persentil, Rataan Kuartil

UKURAN PENYEBARAN (DATA TUNGGAL)
dispersion

Statistika - Ukuran Letak Data (Kuartil, Desil, Persentil)
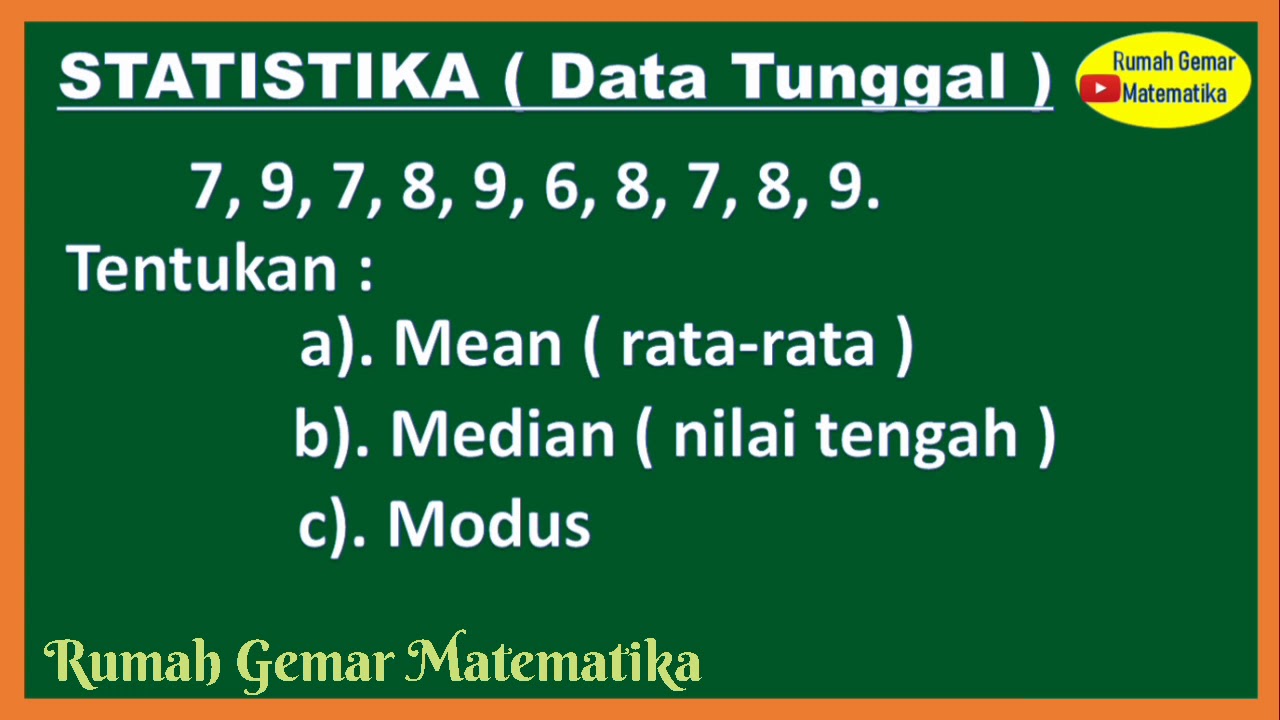
CARA MENENTUKAN MEAN MEDIAN MODUS DATA TUNGGAL||STATISTIKA

Statistika 2 ~ Ukuran Penyebaran Data (Jangkauan, Kuartil, Hamparan) ~ Materi PJJ Kelas VIII / 8 SMP
5.0 / 5 (0 votes)