Statistika 2_Modul 3_Adinda Fidya Anggun Pratiwi
Summary
TLDRIn this video, Adinda Vidangum Pratiwi from Group 9 discusses the topic of correlation and regression from Statistics 2. The video presents a case study where a dermatologist investigates the relationship between daily water consumption and skin health. Adinda walks through the process of analyzing data using RStudio, including calculating the correlation coefficient, creating a scatter plot, and finding the regression equation. She explains the significance of the results, showing how water intake positively affects skin health. The video concludes with a clear explanation of the relationship between the two variables, emphasizing the strong, linear positive correlation.
Takeaways
- 😀 The speaker introduces themselves and provides background information on the statistical task involving correlation and regression analysis.
- 😀 The task focuses on examining the relationship between daily water consumption and skin health, using data from 10 individuals with varying levels of water intake and skin health scores.
- 😀 The speaker explains how they will solve the problem using R Studio, including importing Excel data and calculating the correlation coefficient.
- 😀 To begin, the data is inputted into an Excel spreadsheet and later imported into R Studio for further analysis.
- 😀 The R Studio script includes installing necessary packages, activating libraries, and reading the Excel file into a data frame.
- 😀 The correlation coefficient is calculated, and it turns out to be 0.941245, indicating a strong positive relationship between water consumption and skin health.
- 😀 The speaker emphasizes the importance of proper syntax in R Studio to avoid errors when importing and processing data.
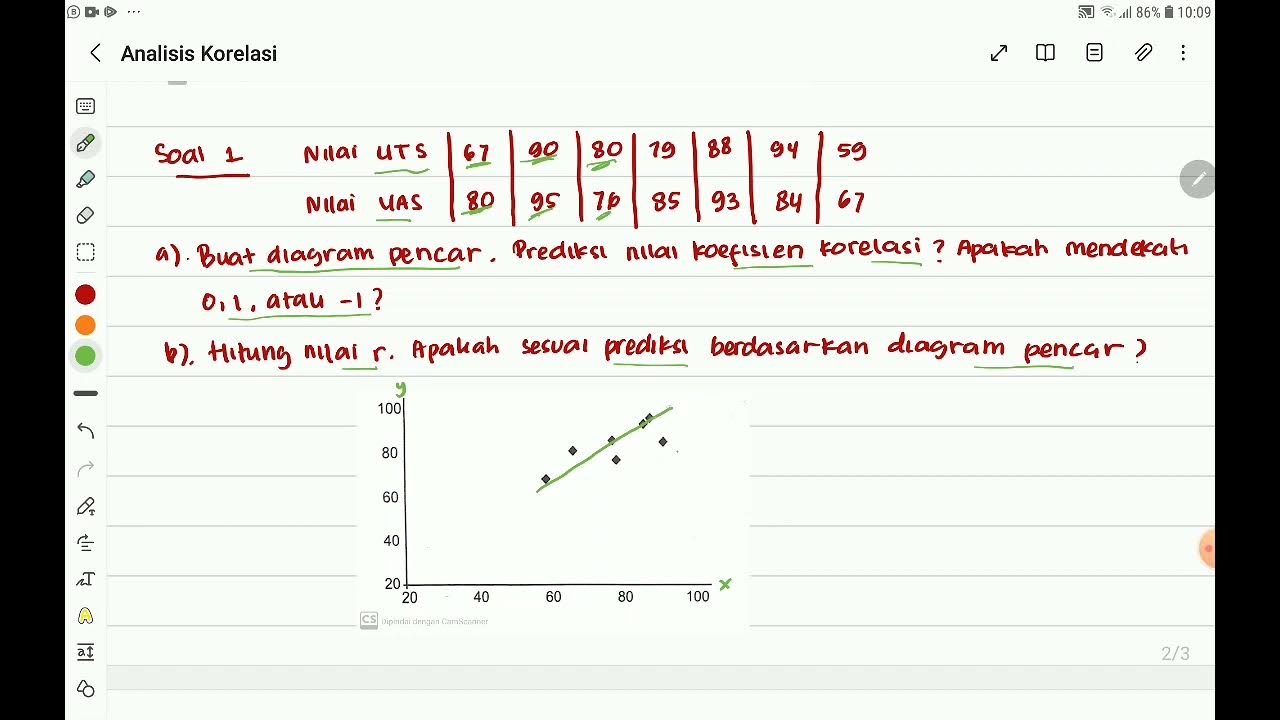
- 😀 A scatter plot is created to visually represent the relationship between water consumption (X) and skin health (Y), with a regression line added to highlight the linear relationship.
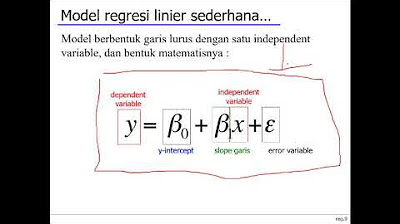
- 😀 The regression model is computed, with the formula Y = 29.86992 + 0.02626X, meaning for every additional unit of water consumed, skin health increases by 0.02626.
- 😀 The confidence interval for the correlation coefficient is between 0.7754773 and 0.987207, which confirms a strong, positive relationship with 95% confidence.
- 😀 The speaker concludes by summarizing the key findings: as water consumption increases, skin health improves, and this relationship is statistically significant and reliable.
Q & A
What is the primary focus of the video task?
-The video focuses on statistical analysis, specifically correlation and regression, using a dataset that relates daily water consumption to skin health ratings.
What statistical method is used in this task?
-The task uses correlation and regression analysis to study the relationship between daily water consumption and skin health.
How many people were involved in the dataset, and what variables were recorded?
-The dataset involves 10 people, and the recorded variables are daily water consumption (in milliliters) and skin health rating (on a scale from 1 to 100).
What is the significance of the coefficient of correlation calculated in the video?
-The coefficient of correlation calculated is 0.941245, which indicates a very strong positive linear relationship between water consumption and skin health. As water consumption increases, skin health improves.
What is the importance of the p-value in this analysis?
-The p-value of 3.985E-05 suggests that the relationship between water consumption and skin health is statistically significant, meaning the results are not due to chance.
What does the 95% confidence interval represent in the results?
-The 95% confidence interval, ranging from 0.7754773 to 0.987207, indicates that with 95% certainty, the true correlation between water consumption and skin health lies within this range.
What is the regression equation derived in the video?
-The regression equation derived is Y = 29.86992 + 0.02626 * X, where Y represents skin health, and X represents daily water consumption in milliliters.
How is the regression equation interpreted in practical terms?
-The regression equation suggests that for every 1 milliliter increase in water consumption, skin health improves by 0.02626 units. The intercept of 29.86992 represents the predicted skin health when no water is consumed (which is a theoretical scenario).
What does the scatter plot indicate about the relationship between the two variables?
-The scatter plot shows a clear positive trend, indicating that as water consumption increases, skin health also increases. The points closely align with the regression line, reinforcing the strong correlation.
What does the regression line represent in the context of the data?
-The regression line represents the best-fit line through the data points, showing the linear relationship between water consumption (X) and skin health (Y). It helps predict skin health based on water consumption.
Outlines

This section is available to paid users only. Please upgrade to access this part.
Upgrade NowMindmap

This section is available to paid users only. Please upgrade to access this part.
Upgrade NowKeywords

This section is available to paid users only. Please upgrade to access this part.
Upgrade NowHighlights

This section is available to paid users only. Please upgrade to access this part.
Upgrade NowTranscripts

This section is available to paid users only. Please upgrade to access this part.
Upgrade NowBrowse More Related Video

Inferential Statistics FULL Tutorial: T-Test, ANOVA, Chi-Square, Correlation & Regression Analysis

Regresi vs korelasi
STATISTICA parte 2.3 : correlazione e regressione
Analisis Korelasi "Nilai Koefisien Korelasi dan Tingkat Korelasi" Part 1 Mtk 11 SMA Kmerdeka
Week 6 Statistika Industri II - Analisis Regresi (part 1)
Pertemuan 1 Statistika sosial
5.0 / 5 (0 votes)