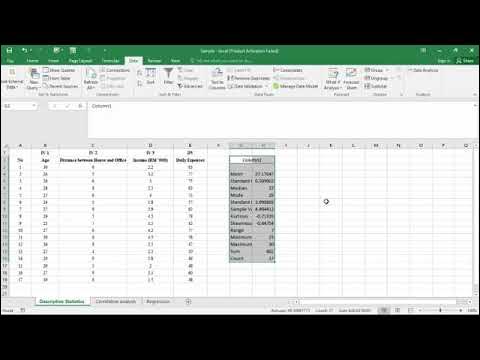
Elemen Regresi 2 IV dengan Excel
Summary
TLDRIn this video, the instructor provides a step-by-step demonstration of how to perform regression analysis using Excel, based on data from the Pedhazur textbook. The focus is on teaching how to calculate various statistical measures, including means, standard deviations, and beta coefficients (B1 and B2), using formulas and Excel functions. The tutorial simplifies complex regression formulas and emphasizes practical Excel skills, ensuring students can apply this knowledge in real-world scenarios, whether they are studying psychology or preparing for roles in other fields. The video concludes with an overview of using software for future calculations.
Takeaways
- 😀 The video discusses regression analysis and the process of calculating formulas in Excel for regression.
- 😀 The data used for the demonstration comes from a book (Pedhazur, page 98) and contains variables like y, x1, and x2 with 20 data points.
- 😀 Excel is emphasized as a tool for calculating and managing statistical data efficiently, which is useful for students and professionals in fields like psychology and business.
- 😀 The speaker demonstrates how to calculate basic statistical values such as sum, mean, and standard deviation using Excel formulas.
- 😀 A specific technique is shown for calculating differences from the mean, ensuring consistency in formulas by using absolute referencing (e.g., $ signs).
- 😀 The script explains how to compute squared values (y^2, x1^2, x2^2) and cross-products (e.g., x1 * x2 * y) in Excel.
- 😀 The process of calculating Beta coefficients (B1 and B2) for regression analysis is demonstrated, including the use of both the numerator and denominator formulas.
- 😀 The speaker emphasizes the importance of understanding statistical concepts and not just performing mechanical calculations with Excel.
- 😀 The importance of variance and standard deviation in calculating regression coefficients and understanding data variability is highlighted.
- 😀 The video concludes with an overview of the regression equation formula and its practical application in analysis, stressing the need for attention to detail in calculations.
Q & A
What is the main objective of the video?
-The main objective of the video is to demonstrate how to manually calculate regression formulas using Excel, specifically for data presented in Pedhazur's book. The focus is on simplifying complex regression calculations.
What data is used in the video to demonstrate regression calculation?
-The data used in the video is from Pedhazur's book, page 98, and includes values for Y, X1, and X2 with 20 data points.
Why is Excel used for the regression calculations in the video?
-Excel is used because it is a commonly available tool for handling data and performing calculations. The aim is to show how students can apply regression analysis in real-world scenarios, even after graduation.
How does the speaker help viewers understand regression calculations?
-The speaker breaks down the steps of calculating the regression formula by demonstrating how to set up and compute various values such as sums, averages, standard deviations, and cross-products in Excel.
What is the purpose of locking the average values with dollar signs in Excel?
-Locking the average values with dollar signs ensures that the formula always references the correct cell when dragged across multiple rows, preventing the reference from shifting as the calculations are applied.
How does the speaker demonstrate the calculation of standard deviation in Excel?
-The speaker explains that standard deviation is calculated as the square root of variance. To find variance, the differences between each value and the mean are squared, summed, and divided by the number of data points.
What is the importance of calculating B1 and B2 in regression analysis?
-B1 and B2 are essential coefficients in the regression equation, representing the relationship between the dependent variable (Y) and the independent variables (X1 and X2). These coefficients are calculated using sums, cross-products, and variances.
What is the formula for calculating the regression equation in the video?
-The regression equation is calculated using the formula Y-hat = B0 + B1 * X1 + B2 * X2, where B1 and B2 are calculated based on the sums of squares and cross-products, and B0 is derived from the intercept.
What is the significance of the R-squared value in regression analysis?
-The R-squared value indicates how well the regression model explains the variability in the dependent variable. It is used to assess the goodness of fit for the regression model.
What are the next steps after learning the manual calculation of regression in the video?
-After learning the manual calculation, the speaker mentions that future lessons will focus on using software tools for regression analysis, which will streamline the process and reduce the chances for errors.
Outlines

This section is available to paid users only. Please upgrade to access this part.
Upgrade NowMindmap

This section is available to paid users only. Please upgrade to access this part.
Upgrade NowKeywords

This section is available to paid users only. Please upgrade to access this part.
Upgrade NowHighlights

This section is available to paid users only. Please upgrade to access this part.
Upgrade NowTranscripts

This section is available to paid users only. Please upgrade to access this part.
Upgrade NowBrowse More Related Video

Cara Menghitung Analisis Regresi Sederhana secara Manual

Uji Regresi Linier Sederhana Dengan SPSS | Pembahasan Lengkap!

Cara Membuat Tabulasi Data Kuesioner di Excel dan SPSS (Contoh Kuesioner Google Form)

Cara Memasukkan Data Awal Sampai Pengolahan Data dari Excel ke SPSS

Descriptive Statistics, Correlation Analysis and Regression Analysis by Using Microsoft Excel

TLE 7- MATATAG CURRICULUM LESSON (1ST QTR)- CREATING SPREADSHEETS W/CONDITIONAL FORMATTING
5.0 / 5 (0 votes)