Cara Membuat Tabulasi Data Kuesioner di Excel dan SPSS (Contoh Kuesioner Google Form)
Summary
TLDRThis video demonstrates how to organize data from a Google Forms questionnaire into a structured format using Excel, focusing on content promotion and brand awareness. The tutorial covers tabulating raw data, aligning variables such as advertising, publicity, and brand recognition, and preparing the data for analysis. It provides step-by-step guidance on entering respondent details, creating summary columns, and formatting the data for SPSS analysis. The video also includes instructions for assigning values to responses and performing simple statistical analysis like regression to evaluate the impact of content promotion on brand awareness.
Takeaways
- 😀 Download survey responses from Google Forms and export them into an Excel spreadsheet for easier analysis.
- 😀 Organize the data into clear categories, such as respondent characteristics (age, gender, education, occupation).
- 😀 Structure the survey questions based on the main variables (Content Promotion and Brand Awareness) to maintain clarity.
- 😀 Use Excel tools like merging cells and adding borders to make the data easy to read and navigate.
- 😀 Group related survey questions under specific indicators (e.g., Advertising, Publicity, Direct Marketing for Content Promotion).
- 😀 Label survey responses with consistent codes (e.g., 1 = Strongly Disagree, 4 = Strongly Agree) for easier analysis later.
- 😀 After tabulating the data in Excel, transfer it to SPSS for more advanced statistical analysis.
- 😀 In SPSS, ensure the correct data types are used (string for non-numeric variables like age and gender, numeric for survey responses).
- 😀 Perform simple regression analysis in SPSS to analyze the relationship between Content Promotion and Brand Awareness.
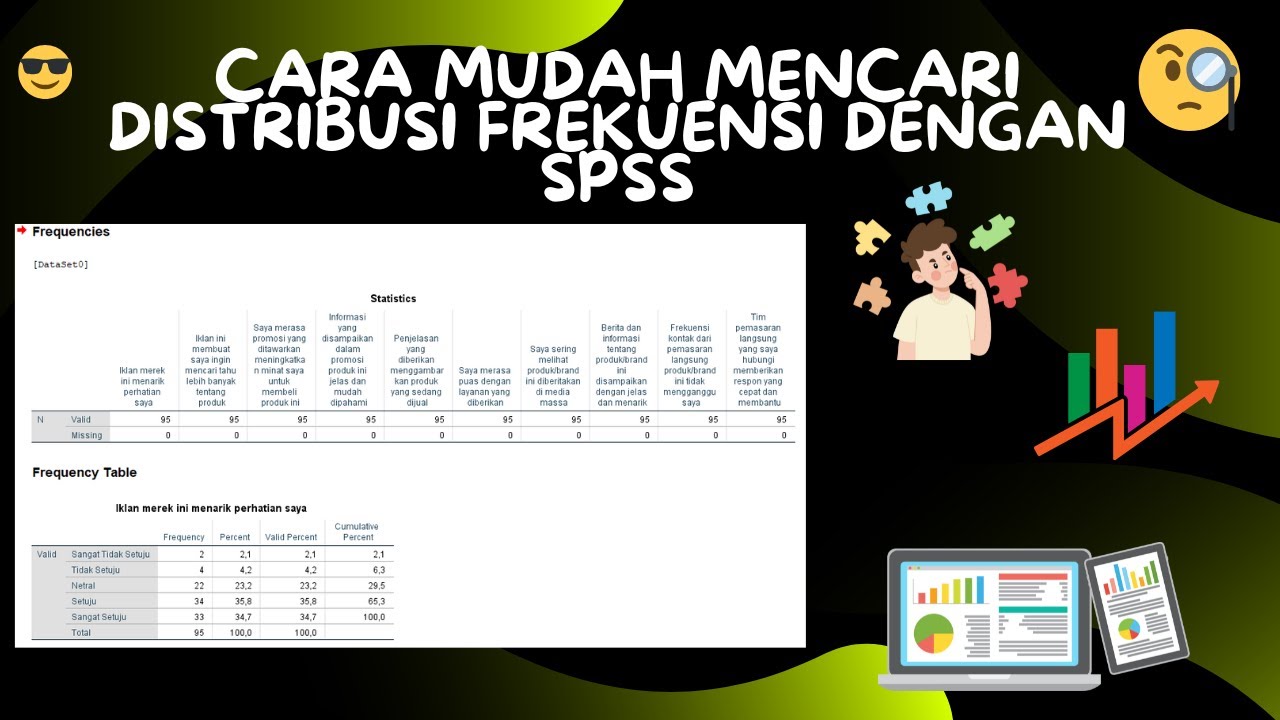
- 😀 Use SPSS to generate frequency distributions to see how respondents answered each survey question.
- 😀 This approach is ideal for organizing and analyzing data from Google Forms surveys and helps in making the data ready for in-depth analysis.
Q & A
What is the main topic of the video tutorial?
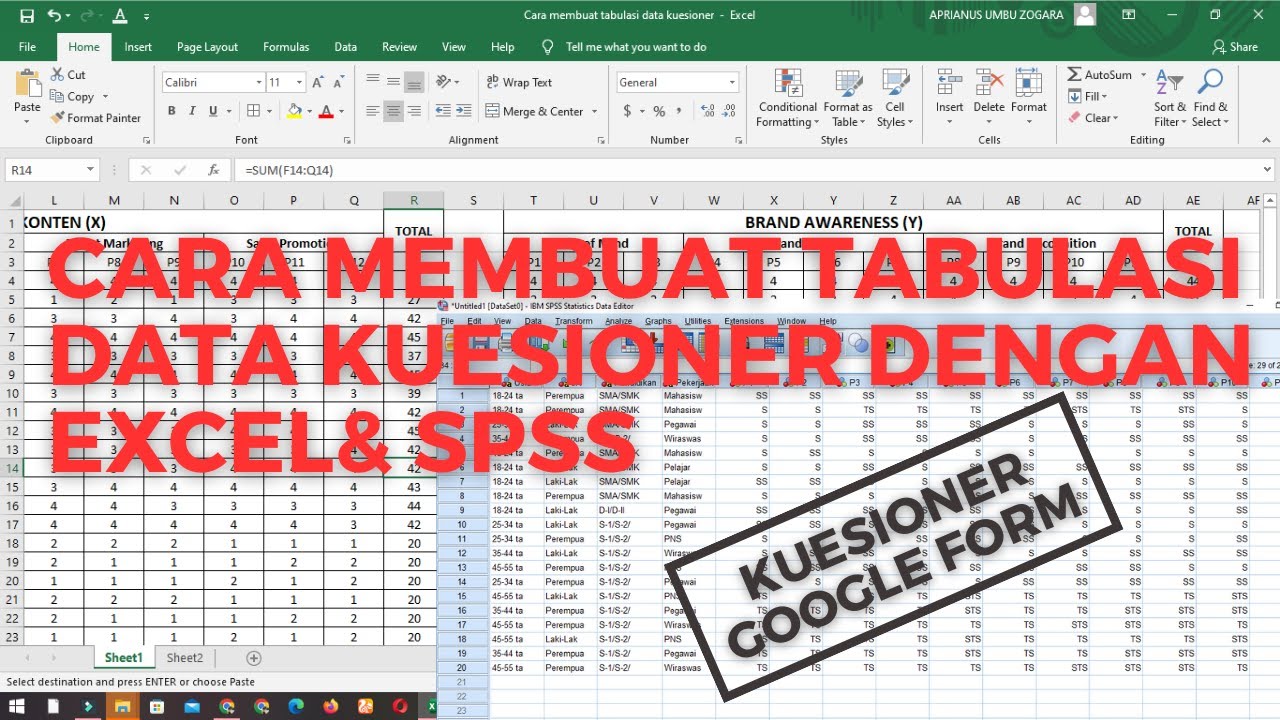
-The video tutorial focuses on how to organize and tabulate questionnaire data from Google Forms using Excel, with an example related to analyzing the impact of Instagram content promotion by Shopee Food on brand awareness.
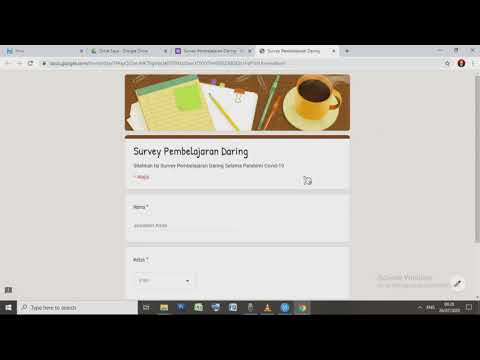
How is the data collected for this case study?
-The data is collected through a Google Forms questionnaire, which is an online survey platform. The responses are then exported into an Excel spreadsheet for further processing and analysis.
What are the two main sections of the questionnaire used in the tutorial?
-The questionnaire is divided into two main sections: content promotion (with 12 items) and brand awareness (with 11 items).
How many respondents are included in the case study?
-The case study includes data from 20 respondents.
What are the four indicators used to measure content promotion in the survey?
-The four indicators for measuring content promotion are Advertising, Publicity, Direct Marketing, and Sales Promotion, each with three associated items.
What is the process of setting up the Excel spreadsheet for data tabulation?
-The process involves creating columns for respondent characteristics (age, gender, education, occupation) and survey items. The data is organized with appropriate borders, merged cells, and column widths to make it clear and easy to understand.
What tool does the tutorial recommend for analyzing the data once it is tabulated?
-The tutorial recommends using SPSS for statistical analysis once the data is properly tabulated in Excel.
What is the role of the 'Total' column in the Excel table?
-The 'Total' column in the Excel table is used to calculate the sum of responses for each indicator, such as total scores for content promotion and brand awareness.
What is the process for entering data into SPSS after tabulating it in Excel?
-After tabulating the data in Excel, the next step is to enter it into SPSS, ensuring that variables like age, gender, education, and occupation are categorized as string variables, while survey items are assigned appropriate numeric values for analysis.
What type of statistical analysis does the tutorial suggest conducting with the data?
-The tutorial suggests performing regression analysis to examine the influence of content promotion on brand awareness, along with frequency analysis to explore the distribution of responses.
Outlines

This section is available to paid users only. Please upgrade to access this part.
Upgrade NowMindmap

This section is available to paid users only. Please upgrade to access this part.
Upgrade NowKeywords

This section is available to paid users only. Please upgrade to access this part.
Upgrade NowHighlights

This section is available to paid users only. Please upgrade to access this part.
Upgrade NowTranscripts

This section is available to paid users only. Please upgrade to access this part.
Upgrade NowBrowse More Related Video
Cara Membuat Tabulasi Data Kuesioner Dengan Excel & SPSS
Cara Membuat Kuesioner/Lembar Survey Di Google Form

pivot tabel, informatika Kl 8 bab 6 Analisis Data kurikulum Merdeka bag 37 hal 149 153

Bab 6 Analisis Data | Informatika Kelas 10 Kurikulum Merdeka

CARA ANALISA DESKRIPTIF TINGKAT CAPAIAN RESPONDEN,TCR,TOTAL SKOR,RATA RATA,MEAN,KATEGORI,EXCEL SPSS
Cara Mudah Mencari Distribusi Frekuensi Dengan SPSS
5.0 / 5 (0 votes)