Menggambar Grafik Fungsi Piecewise
Summary
TLDRIn this video, the concept of piecewise functions is explained, focusing on how they are defined by multiple formulas across different domains. The video covers examples such as absolute value functions and step functions, and demonstrates how to calculate values for piecewise functions based on given conditions. Additionally, it explores graphing techniques for linear and non-linear piecewise functions, providing clear, step-by-step instructions for calculating and visualizing these functions. This tutorial aims to help viewers understand the practical application of piecewise functions in mathematical problems.
Takeaways
- 😀 A piecewise function is defined by different formulas or expressions in different regions of its domain. It's also called a 'broken function' or 'segmented function'.
- 😀 Piecewise functions are often used in absolute value functions and step functions.
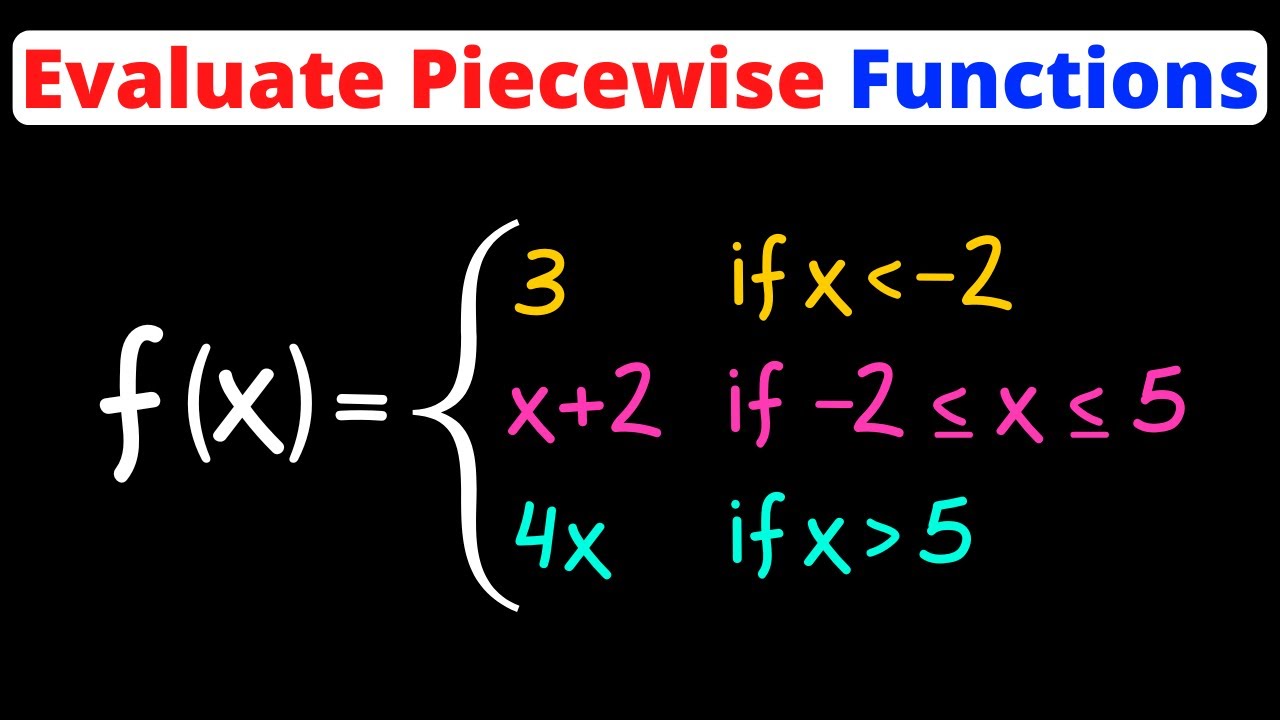
- 😀 To calculate the value of a piecewise function at a specific point, determine which interval the point belongs to, then use the corresponding formula.
- 😀 For example, for a function defined by f(x) = x^2 for x < 0, f(x) = 2 for x = 0, and f(x) = 2x + 1 for x > 0, you calculate f(-2), f(0), and f(2) by selecting the appropriate formulas based on the domain.
- 😀 When calculating for x = -2, since -2 is less than 0, the formula f(x) = x^2 is used, resulting in f(-2) = 4.
- 😀 For x = 0, the function f(x) = 2 is used since x = 0 directly matches the middle domain, giving f(0) = 2.
- 😀 For x = 2, the function f(x) = 2x + 1 is used since 2 is greater than 0, resulting in f(2) = 5.
- 😀 Another example shows a piecewise function defined by f(x) = 2x - 4 for x in the interval [-1, 2] and f(x) = x^3 - 2 for x in the interval (2, 3]. Calculating f(0), f(1), f(2), and f(3) involves selecting the appropriate formula for each interval.
- 😀 Graphing piecewise functions requires identifying key points, determining the appropriate formulas, and plotting the points. The function's continuity at boundaries is important.
- 😀 When graphing, open circles (hollow points) are used for boundaries that are not included in the domain, while filled circles indicate that the boundary is part of the domain.
Q & A
What is a piecewise function?
-A piecewise function is defined by multiple formulas or expressions, each valid for a certain domain or interval of input values. It is also known as a 'split function' or 'segmented function'.
How is a piecewise function defined in terms of different domains?
-A piecewise function consists of several formulas that apply to different parts of the domain. Each formula corresponds to a specific interval, and the function is evaluated according to which interval the input value belongs to.
Give an example of a piecewise function.
-Examples of piecewise functions include the absolute value function and the step function (or staircase function), which are both defined by different formulas over distinct intervals.
How do you evaluate a piecewise function for a given value?
-To evaluate a piecewise function, first identify the domain or interval that the input value belongs to, then apply the corresponding formula for that interval. For instance, if x = -2, you would use the formula valid for x < 0.
What happens when evaluating f(-2) in a piecewise function?
-When evaluating f(-2), since -2 is less than 0, you use the formula for x^2. Therefore, f(-2) = (-2)^2 = 4.
How do you handle the function when x = 0 in a piecewise function?
-When x = 0, you use the formula defined for x = 0. For example, if the formula is f(x) = 2 for x = 0, then f(0) = 2.
How do you evaluate f(2) in a piecewise function?
-For f(2), since 2 is greater than 0, you use the formula for x > 0, such as 2x + 1. Substituting x = 2 into this formula, f(2) = 2 * 2 + 1 = 5.
How do you approach graphing a piecewise function?
-To graph a piecewise function, you first plot the points determined by the formulas for each interval, then connect the points with straight lines or curves. Special attention is given to the boundaries between intervals, where open or closed circles are used to indicate whether the boundary value is included in the function.
What is the significance of closed and open circles in piecewise function graphs?
-In piecewise function graphs, closed circles (filled) indicate that the endpoint is included in the interval (e.g., x ≤ 3), while open circles (unfilled) indicate that the endpoint is not included (e.g., x < 3).
How can we graph the function f(x) = 2x - 4 for x in [-1, 2] and x in [2, 3]?
-For x in [-1, 2], use the formula f(x) = 2x - 4. Evaluate at x = -1, 0, and 2. For x in [2, 3], use the formula f(x) = x^3 - 2. Evaluate at x = 2 and 3, and plot these points on a graph. Connect them accordingly with lines and apply the appropriate circle for endpoints.
Outlines

This section is available to paid users only. Please upgrade to access this part.
Upgrade NowMindmap

This section is available to paid users only. Please upgrade to access this part.
Upgrade NowKeywords

This section is available to paid users only. Please upgrade to access this part.
Upgrade NowHighlights

This section is available to paid users only. Please upgrade to access this part.
Upgrade NowTranscripts

This section is available to paid users only. Please upgrade to access this part.
Upgrade NowBrowse More Related Video
FUNGSI PIECEWISE || PRESENTASI KELOMPOK 5 XI 13-SMASTA

A Tale of Three Functions | Intro to Limits Part I

PIECEWISE FUNCTIONS || GRADE 11 GENERAL MATHEMATICS Q1
Evaluate a Piecewise Function | Eat Pi

Word Problems Involving Piecewise Functions
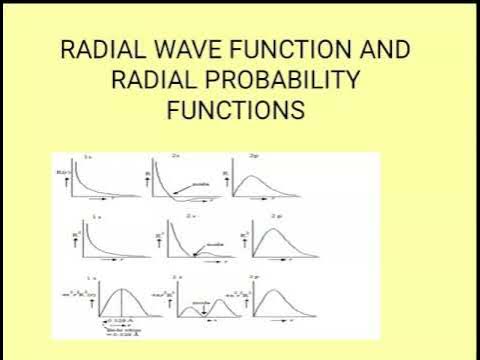
Radial wave function, radial probability, radial probability distribution graph
5.0 / 5 (0 votes)