MEASURES OF VARIATION: RANGE, VARIANCE AND STANDARD DEVIATION FOR GROUPED DATA
Summary
TLDRThis tutorial explains how to calculate the range, variance, and standard deviation for grouped data using class boundaries, class marks, and frequencies. The video walks through each step clearly, starting with finding the range by subtracting the lowest class boundary from the highest. It then shows how to compute the variance by using the class marks and their frequencies, followed by calculating the standard deviation as the square root of the variance. This step-by-step guide helps viewers understand how to analyze data from a frequency distribution effectively.
Takeaways
- 😀 Range for group data is calculated by subtracting the lowest class boundary from the highest class boundary.
- 😀 To find the class boundaries for grouped data, add and subtract 0.5 from the given class limits.
- 😀 In group data, to compute the range, subtract the lowest class boundary (4.5) from the highest class boundary (58.5), resulting in a range of 54.
- 😀 Class marks, also known as midpoints, are computed by adding the class limits and dividing by 2 for each class interval.
- 😀 Frequency (f) times class mark (x) gives the f * x product, which is used in subsequent calculations.
- 😀 The mean for group data is calculated by dividing the sum of f * x values by the total number of frequencies (n).
- 😀 Variance is computed by first finding the squared differences between each class mark and the mean, multiplying them by the frequency, and summing these values.
- 😀 The formula for variance is the sum of f * (x - mean)^2 divided by (n - 1).
- 😀 The standard deviation is the square root of the variance, providing a measure of spread for the group data.
- 😀 The final standard deviation value is calculated as the square root of 160.98, which results in approximately 12.69.
- 😀 This tutorial explains the process for calculating range, variance, and standard deviation for grouped data using class boundaries, frequencies, and class marks.
Q & A
What is the key focus of the video script?
-The video focuses on teaching how to calculate range, variance, and standard deviation for grouped data, using an example of quiz scores from 40 students.
How is the range calculated for grouped data?
-For grouped data, the range is calculated by subtracting the lowest class boundary from the highest class boundary. For example, if the highest boundary is 58.5 and the lowest is 4.5, the range is 58.5 - 4.5 = 54.
What are class boundaries, and how are they determined?
-Class boundaries are the adjusted limits of each class, which are obtained by subtracting 0.5 from the lower class limit and adding 0.5 to the upper class limit. For example, for a class of 53-58, the class boundaries would be 52.5 to 58.5.
What is a class mark, and how do you calculate it?
-A class mark is the midpoint of a class. It is calculated by averaging the lower and upper class limits. For the class 53-58, the class mark would be (53 + 58) / 2 = 55.5.
How do you calculate the mean for grouped data?
-The mean for grouped data is calculated by dividing the sum of the products of frequency and class mark (fx) by the total frequency (n). For example, if the sum of fx values is 1212 and n is 40, the mean would be 1212 / 40 = 30.3.
What is the next step after calculating the class mark in the process of finding variance?
-After calculating the class marks, the next step is to calculate the squared difference between each class mark and the mean, then multiply the squared differences by their corresponding frequencies.
What formula is used to calculate the variance for grouped data?
-The variance is calculated using the formula: Variance = (Sum of f(x - x̄)²) / (n - 1), where f is the frequency, x is the class mark, and x̄ is the mean.
How is the standard deviation calculated from the variance?
-The standard deviation is calculated by taking the square root of the variance. For example, if the variance is 160.98, the standard deviation would be √160.98 ≈ 12.69.
What is the total frequency (n) in the example provided?
-In the example provided, the total frequency (n) is 40, as there are 40 students in the quiz.
What is the significance of calculating the squared difference between class marks and the mean?
-The squared difference helps in measuring the spread or dispersion of data. By squaring the differences, we avoid negative values and ensure that larger deviations have a more significant impact on the variance and standard deviation.
Outlines

This section is available to paid users only. Please upgrade to access this part.
Upgrade NowMindmap

This section is available to paid users only. Please upgrade to access this part.
Upgrade NowKeywords

This section is available to paid users only. Please upgrade to access this part.
Upgrade NowHighlights

This section is available to paid users only. Please upgrade to access this part.
Upgrade NowTranscripts

This section is available to paid users only. Please upgrade to access this part.
Upgrade NowBrowse More Related Video
Variance and Standard Deviation for Grouped Data

Statistika Bagian 7 - Simpangan Baku dan Varian Data Tunggal dan Data Berkelompok

Measure of Central Tendency of Grouped Data for beginners
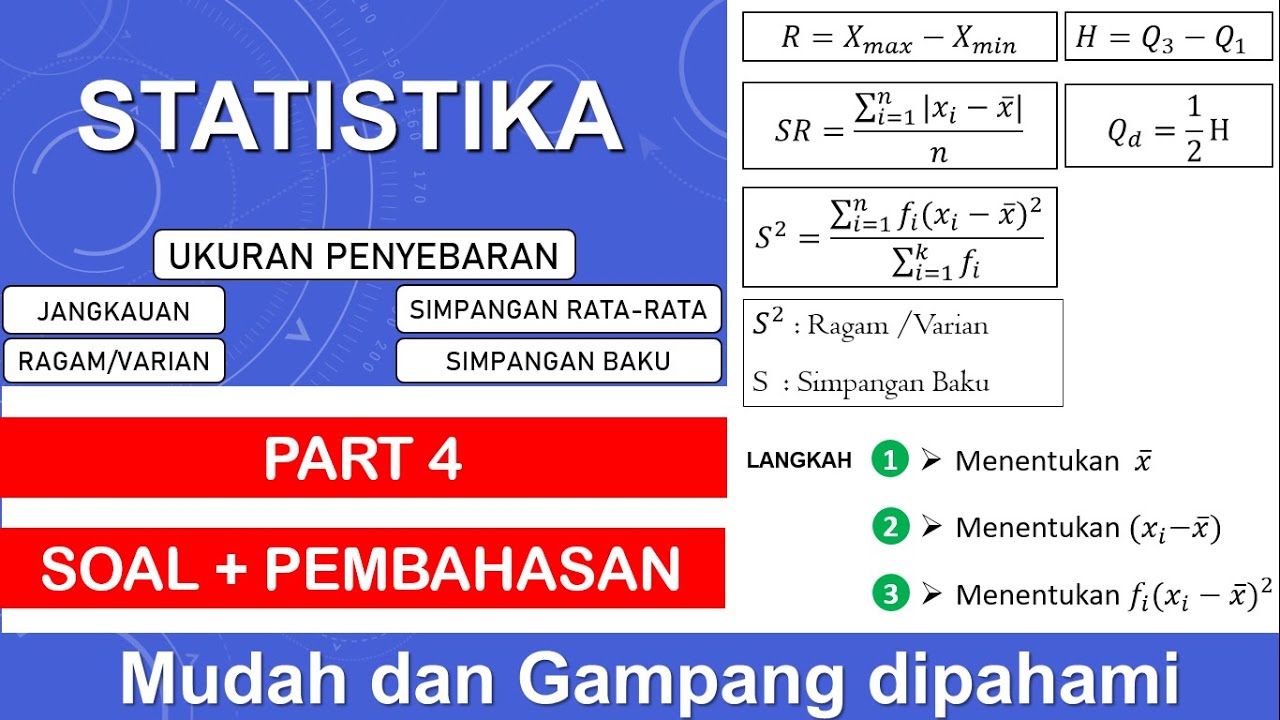
Statistika Part. 4 | Ukuran Penyebaran, Ragam, Varian, Simpangan Rata-rata, Simpangan Baku
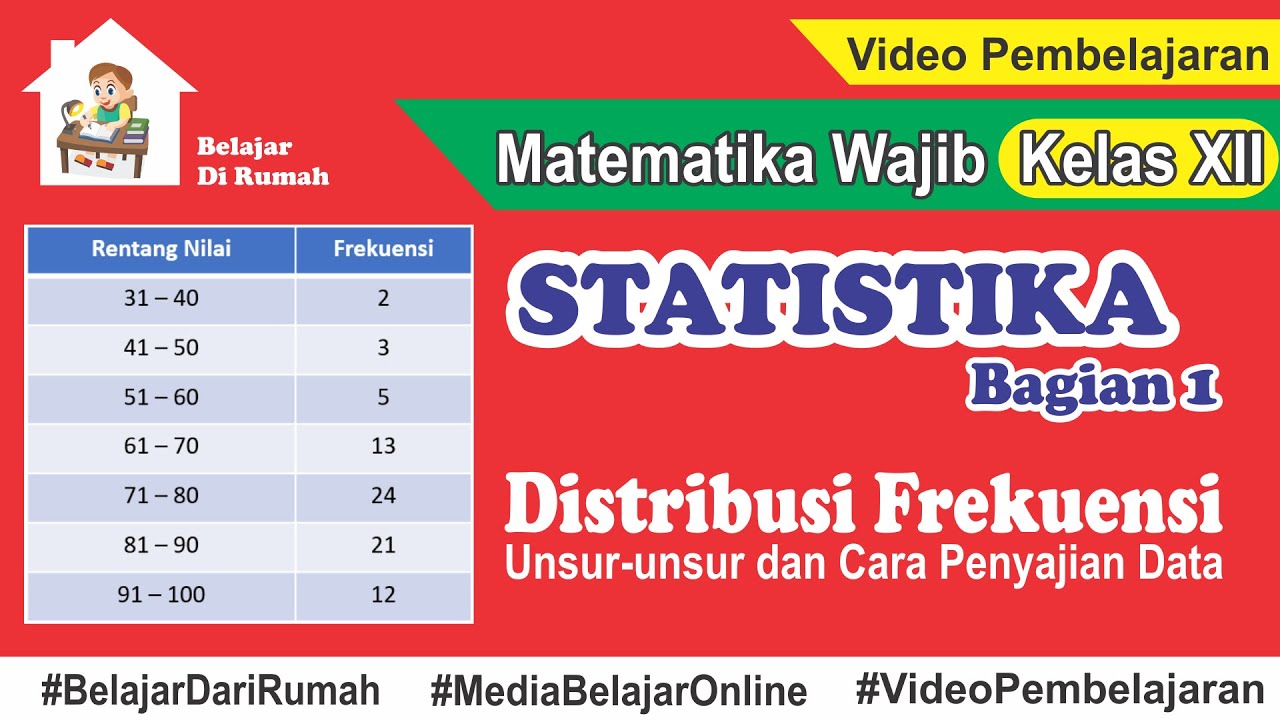
Statistika Bagian 1 - Mengenal Unsur-unsur serta Cara Penyajian Data Tabel Distribusi Frekuensi

Range, Variance, Standard Deviation in Excel
5.0 / 5 (0 votes)