Range, Variance, Standard Deviation in Excel
Summary
TLDRThis tutorial walks through how to calculate the range, variance, and standard deviation of a data set in Excel. To find the range, the maximum and minimum values are identified using the MIN and MAX functions. The sample variance is calculated using the VAR.S function, while the sample standard deviation is calculated using the STDEV.S function. The tutorial emphasizes the steps to apply these functions in Excel for analyzing data, making statistical computations easy and accessible for users.
Takeaways
- 😀 The range is calculated by subtracting the minimum value from the maximum value.
- 😀 To find the minimum value in Excel, use the `=MIN()` function and highlight the data.
- 😀 To find the maximum value in Excel, use the `=MAX()` function and highlight the data.
- 😀 Once the minimum and maximum values are found, subtract the minimum from the maximum to calculate the range.
- 😀 The variance can be calculated using the `=VAR.S()` function for sample variance in Excel.
- 😀 To calculate variance, scroll through the function options and select `VAR.S()` instead of `VAR.P()` for sample variance.
- 😀 The `=VAR.P()` function calculates population variance, which is not the focus here.
- 😀 For the sample standard deviation, use the `=STDEV.S()` function in Excel.
- 😀 When using `=STDEV.S()`, highlight the data to get the sample standard deviation.
- 😀 Always use `=VAR.S()` and `=STDEV.S()` for sample data calculations (not population data).
- 😀 Excel provides an easy way to calculate these statistical measures using simple functions.
Q & A
What function do you use in Excel to find the minimum value of a data set?
-You can use the 'MIN' function in Excel. Simply type '=MIN', highlight the data, and press Enter to find the minimum value.
How do you find the maximum value of a data set in Excel?
-To find the maximum value, use the 'MAX' function in Excel. Type '=MAX', highlight the data, and press Enter.
What is the formula to calculate the range in Excel?
-The range is calculated as the difference between the maximum and minimum values. After finding both with the 'MAX' and 'MIN' functions, subtract the minimum value from the maximum value.
What Excel function is used to calculate the sample variance?
-The 'VAR.S' function is used to calculate the sample variance. Type '=VAR.S', select the data, and press Enter.
How does the 'VAR' function differ from the 'VAR.S' function in Excel?
-'VAR' calculates the population variance, while 'VAR.S' is used for sample variance. For sample data, use 'VAR.S' to get a more accurate result.
How do you find the sample standard deviation in Excel?
-Use the 'STDEV.S' function to find the sample standard deviation. Type '=STDEV.S', select the data, and press Enter.
What is the difference between 'STDEV.P' and 'STDEV.S' in Excel?
-'STDEV.P' is used for population standard deviation, while 'STDEV.S' is for sample standard deviation. When dealing with sample data, 'STDEV.S' is more appropriate.
Why is the 'VAR.S' function used for sample variance instead of 'VAR'?
-'VAR.S' is specifically designed for sample data, whereas 'VAR' is meant for population variance. Using 'VAR.S' for samples ensures the correct formula is applied.
What does the range represent in a data set?
-The range represents the difference between the maximum and minimum values in a data set, giving an indication of the spread of the data.
What would happen if you mistakenly used 'VAR' instead of 'VAR.S' for sample data?
-Using 'VAR' for sample data would give you the population variance, which would likely lead to inaccurate results since the formula for sample variance adjusts for sample size.
Outlines

This section is available to paid users only. Please upgrade to access this part.
Upgrade NowMindmap

This section is available to paid users only. Please upgrade to access this part.
Upgrade NowKeywords

This section is available to paid users only. Please upgrade to access this part.
Upgrade NowHighlights

This section is available to paid users only. Please upgrade to access this part.
Upgrade NowTranscripts

This section is available to paid users only. Please upgrade to access this part.
Upgrade NowBrowse More Related Video

MEASURES OF VARIATION: RANGE, VARIANCE AND STANDARD DEVIATION FOR GROUPED DATA
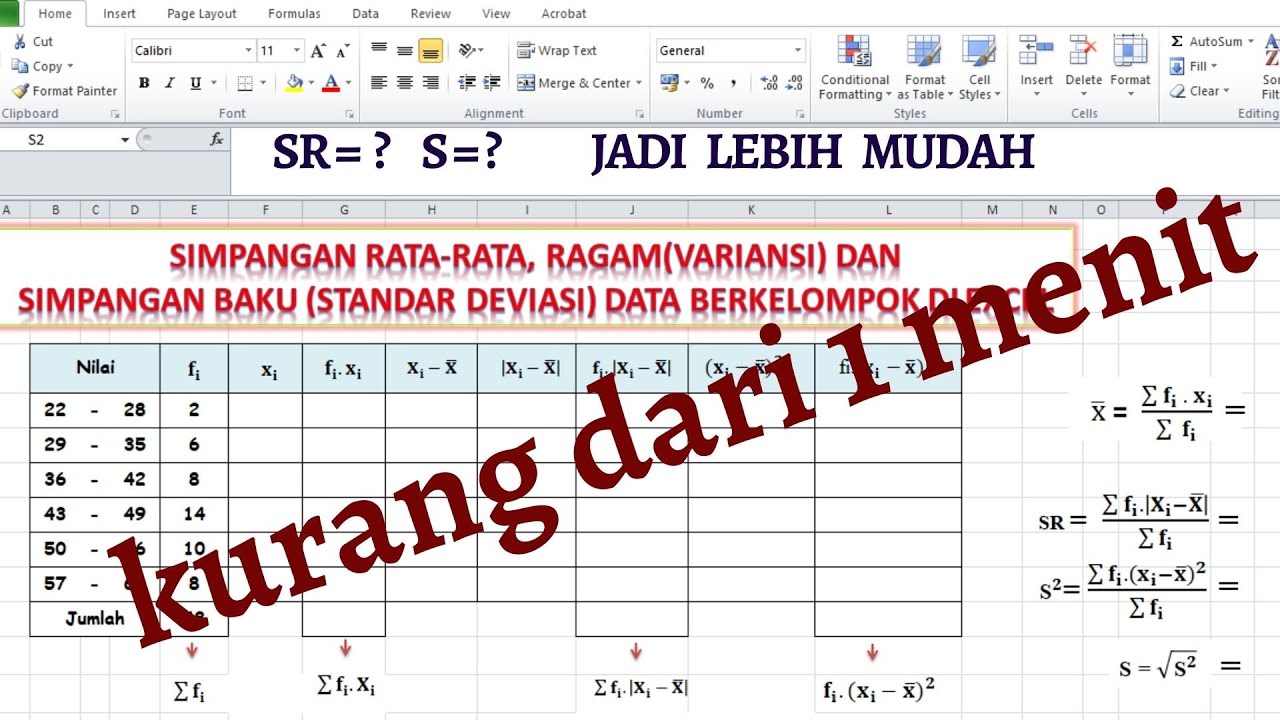
MENGHITUNG SIMPANGAN RATA-RATA, RAGAM DAN SIMPANGAN BAKU DATA KELOMPOK DI EXCEL

Range, variance and standard deviation as measures of dispersion | Khan Academy
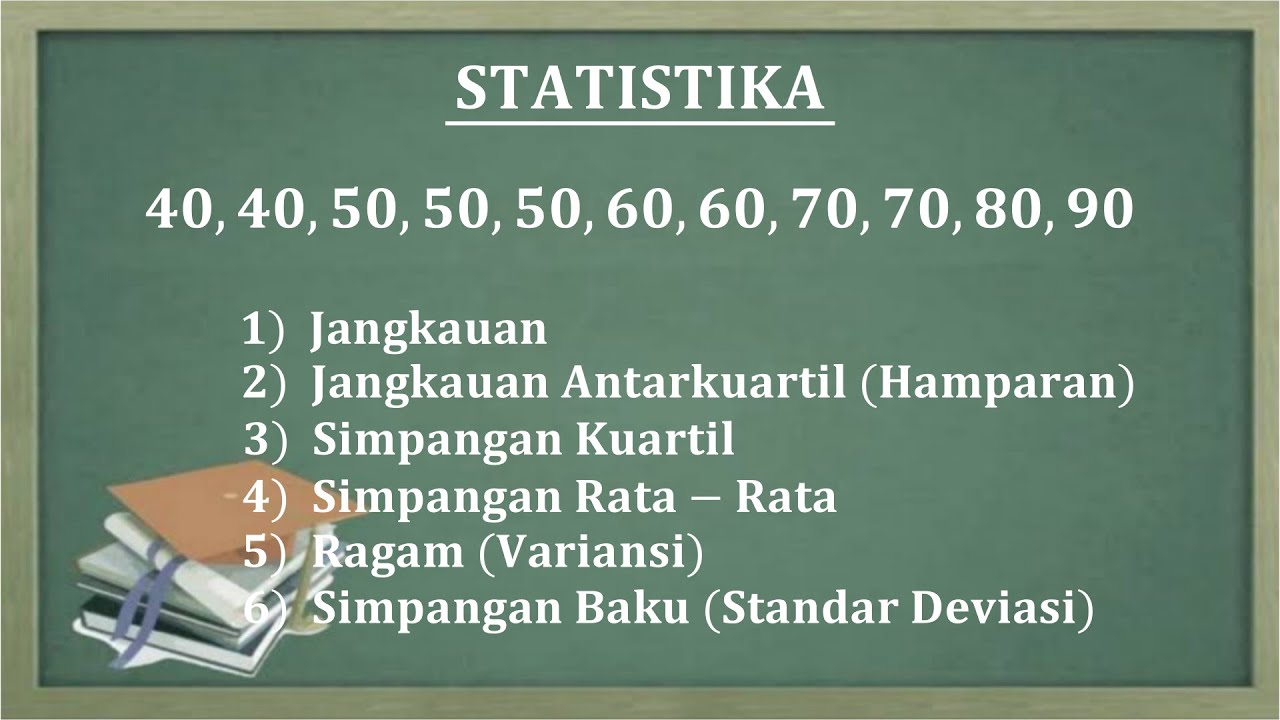
JANGKAUAN, HAMPARAN, SIMPANGAN KUARTIL, SIMPANGAN RATA RATA, RAGAM DAN STANDAR DEVIASI
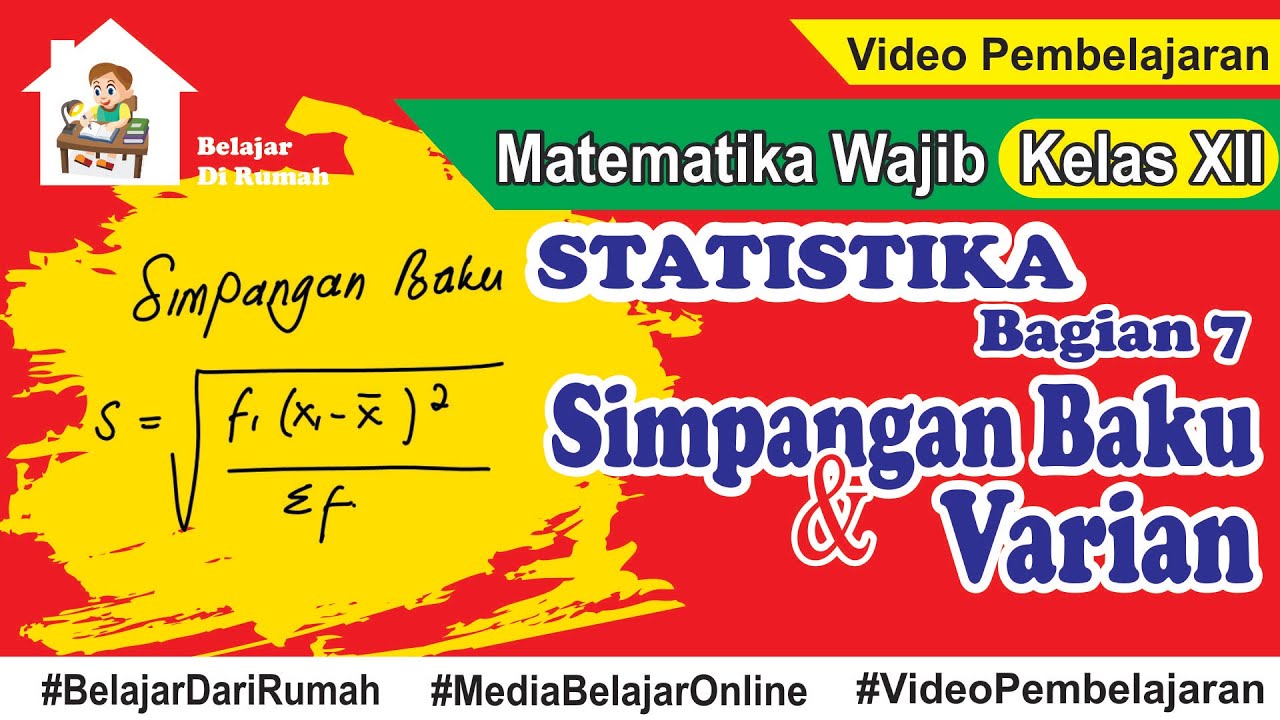
Statistika Bagian 7 - Simpangan Baku dan Varian Data Tunggal dan Data Berkelompok

Variance (Simply explained)
5.0 / 5 (0 votes)