Statistika Part. 4 | Ukuran Penyebaran, Ragam, Varian, Simpangan Rata-rata, Simpangan Baku
Summary
TLDRIn this educational video, the presenter explains key statistical measures of spread, including range, mean deviation, variance, and standard deviation. These concepts are broken down with simple examples, making them easy to understand. The video covers both individual and grouped data, showing how to calculate the range, mean deviation, variance, and standard deviation step by step. The focus is on making complex statistical concepts accessible and understandable for viewers, with clear explanations and practical applications.
Takeaways
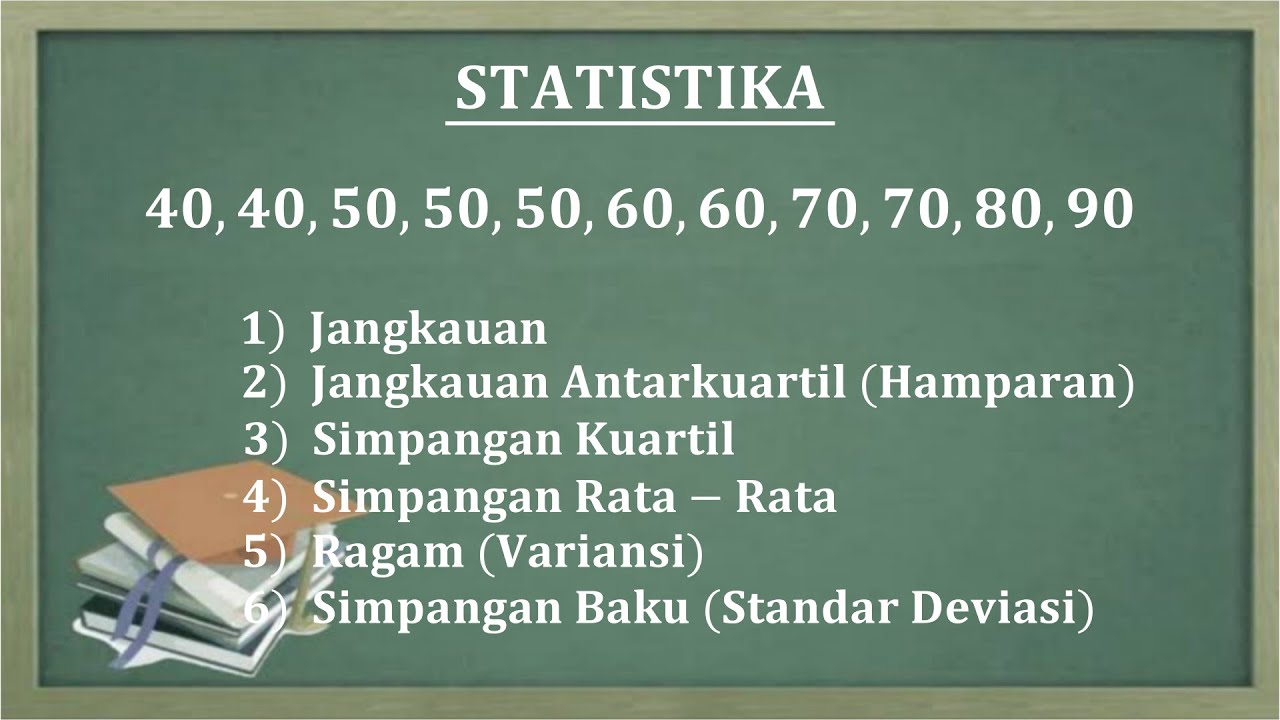
- 😀 Range (Jangkauan) is the difference between the largest and smallest values in a data set, helping measure the spread of data.
- 😀 The range for grouped data is calculated by finding the difference between the midpoints of the highest and lowest class intervals.
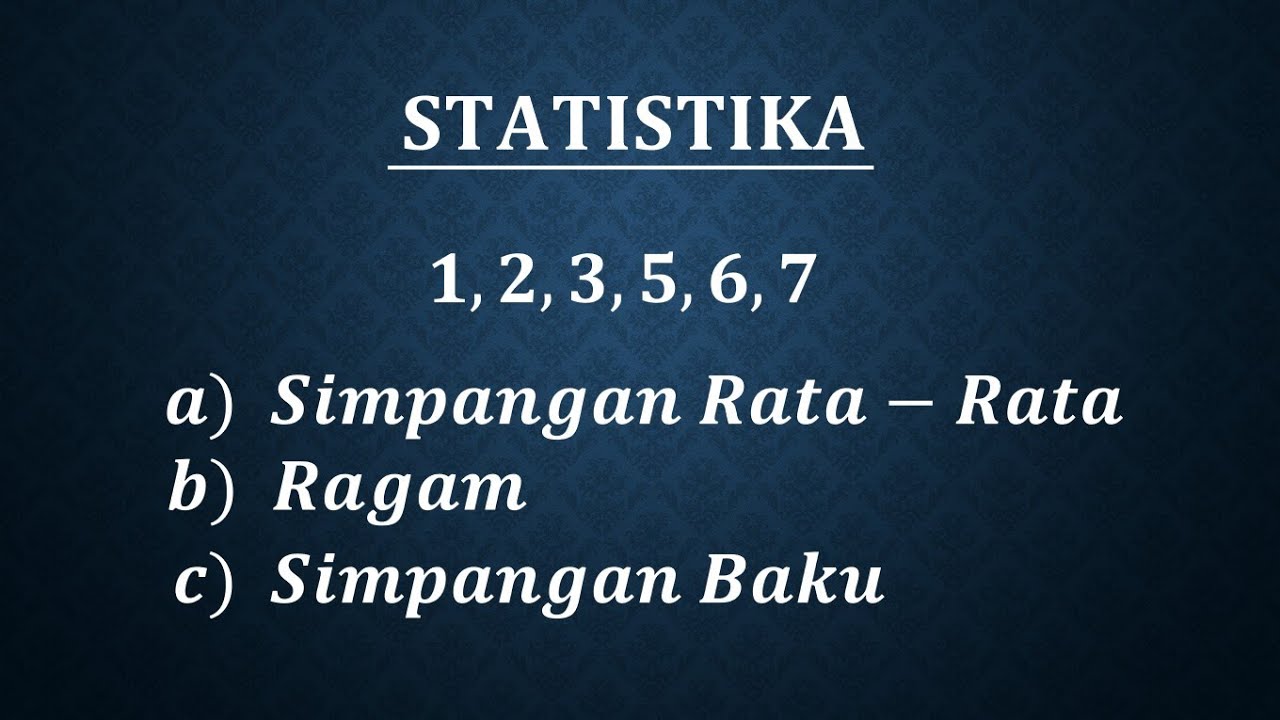
- 😀 Mean deviation (Simpangan Rata-Rata) measures the average of the absolute differences between each data point and the mean of the data set.
- 😀 For individual data, mean deviation is calculated by subtracting the mean from each data point, taking the absolute value, and averaging the results.
- 😀 In grouped data, the mean deviation involves calculating the mean using the midpoints of the class intervals and then applying the mean deviation formula.
- 😀 Variance (Ragam/Varian) measures the squared differences from the mean and provides a quantitative measure of how spread out the data points are.
- 😀 For individual data, variance is calculated by squaring the differences between each data point and the mean, then averaging those squared values.
- 😀 In grouped data, variance involves calculating the mean from the midpoints, then using the variance formula based on the frequencies of the data.
- 😀 Standard deviation (Simpangan Baku) is the square root of variance and is used to measure the spread of data points around the mean.
- 😀 Both variance and standard deviation help assess the dispersion or spread of data and are essential tools in understanding the variability within data sets.
- 😀 The video explains these statistical measures with easy-to-understand examples for both individual and grouped data, making the concepts accessible to beginners.
Q & A
What is the range in statistics and how is it calculated?
-The range in statistics is the difference between the largest and smallest data values. For a single dataset, it is calculated by subtracting the smallest data value from the largest data value. For example, in the dataset [3, 5, 6, 8, 9, 10], the range is 10 - 3 = 7.
How do you calculate the range for grouped data with class intervals?
-For grouped data, the range is calculated by finding the difference between the midpoints of the highest and lowest class intervals. For example, for the class intervals [14-23], the midpoints are 14 and 23, so the range is 23 - 14 = 9.
What is mean deviation and how is it calculated?
-Mean deviation measures how far each data point is from the mean. It is calculated by taking the absolute differences between each data value and the mean, summing them up, and then dividing by the number of data points. For example, for the dataset [3, 4, 5, 6, 7], the mean deviation is 6 / 5 = 1.2.
How do you calculate the mean deviation for grouped data?
-For grouped data, the formula for mean deviation changes slightly. You first calculate the mean, then find the absolute deviations from the mean for each class midpoint. These deviations are then multiplied by the frequency of each class, summed, and divided by the total frequency.
What is variance and how is it computed for a single dataset?
-Variance is a measure of how spread out the data is. For a single dataset, it is calculated by finding the squared differences between each data point and the mean, summing them, and dividing by the number of data points. For example, for the dataset [3, 4, 5, 6, 7], the variance is 2.
How is variance calculated for grouped data?
-For grouped data, variance is calculated by first finding the mean, then subtracting the mean from the midpoint of each class interval. The squared differences are multiplied by the frequencies, summed up, and divided by the total frequency.
What is standard deviation and how is it related to variance?
-Standard deviation is the square root of variance and represents how much the individual data points differ from the mean. It is a more interpretable measure of spread than variance. For a dataset with variance 2, the standard deviation would be √2 ≈ 1.41.
Why is standard deviation considered more useful than variance?
-Standard deviation is often considered more useful than variance because it is in the same units as the original data, making it easier to interpret. Variance, on the other hand, is in squared units, which can be harder to understand in the context of the original data.
How do you calculate standard deviation for grouped data?
-To calculate the standard deviation for grouped data, you first calculate the variance using the steps for grouped data, and then take the square root of the variance.
What role do frequencies play in calculating mean deviation, variance, and standard deviation for grouped data?
-Frequencies are crucial in calculating mean deviation, variance, and standard deviation for grouped data because they adjust the calculations to account for how often each class interval occurs. This ensures that the spread of the data is weighted correctly according to the frequencies.
Outlines

This section is available to paid users only. Please upgrade to access this part.
Upgrade NowMindmap

This section is available to paid users only. Please upgrade to access this part.
Upgrade NowKeywords

This section is available to paid users only. Please upgrade to access this part.
Upgrade NowHighlights

This section is available to paid users only. Please upgrade to access this part.
Upgrade NowTranscripts

This section is available to paid users only. Please upgrade to access this part.
Upgrade NowBrowse More Related Video
Simpangan rata-rata, ragam dan simpangan baku data tunggal

Ukuran Penyebaran Data Tunggal | Statistika Matematika Wajib Kelas 12 | Catatan Matematika @Bang-RP
JANGKAUAN, HAMPARAN, SIMPANGAN KUARTIL, SIMPANGAN RATA RATA, RAGAM DAN STANDAR DEVIASI

Range, variance and standard deviation as measures of dispersion | Khan Academy

Ilmu Data #5 - Varians dan Standar Deviasi

UKURAN PENYEBARAN (DATA TUNGGAL)
5.0 / 5 (0 votes)